|
Economic Definitions
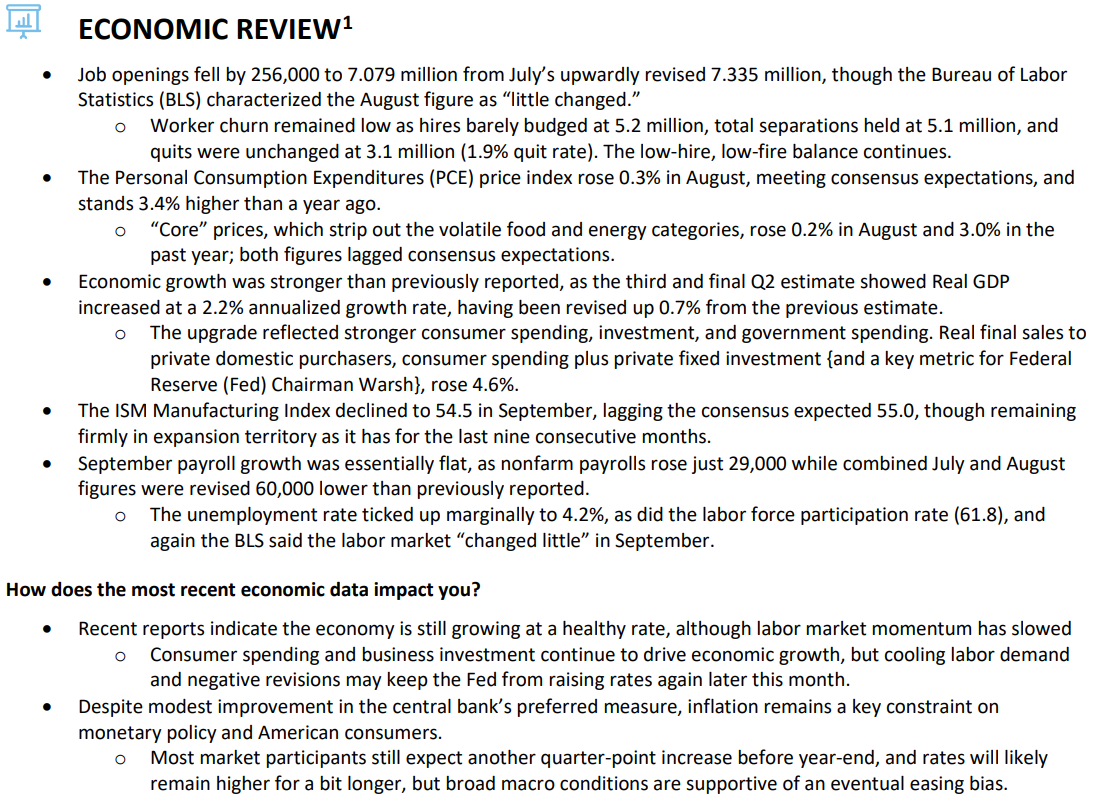
Employment Report (Jobs Report): Formally known as the Employment Situation, the monthly Bureau of Labor Statistics report provides a broad view of U.S. labor-market conditions using two surveys. It includes key measures such as nonfarm payroll growth, the unemployment rate, labor-force participation, average hourly earnings and the average workweek, along with employment trends across major industries.
Federal Reserve (Fed): The Federal Reserve System is the central banking system of the United States of America.
GDP: Gross domestic product (GDP) measures the final market value of all goods and services produced within a country. It is the most frequently used indicator of economic activity. The GDP by expenditure approach measures total final expenditures (at purchasers' prices), including exports less imports. This concept is adjusted for inflation.
ISM Manufacturing PMI: Measures the direction of U.S. manufacturing activity based on a monthly survey of supply management executives across industries, covering areas such as new orders, production, employment, supplier deliveries and inventories; readings above 50 generally indicate manufacturing expansion, while readings below 50 indicate contraction.
ISM Services Index: The Services ISM PMI (formerly the ISM Report On Business) is based on data compiled from purchasing and supply executives nationwide. Survey responses reflect the change, if any, in the current month compared to the previous month. For each of the indicators measured (Business Activity, New Orders, Backlog of Orders, New Export Orders, Inventory Change, Inventory Sentiment, Imports, Prices, Employment and Supplier Deliveries) this report shows the percentage reporting each response, and the diffusion index. An index reading above 50 percent indicates that the non-manufacturing economy in that index is generally expanding; below 50 percent indicates that it is generally declining. Orders to the service producers make up about 90 percent of the US economy.
Job Openings and Labor Turnover Survey (JOLTS): This concept tracks the number of specific job openings in an economy. Job vacancies generally include either newly created or unoccupied positions (or those that are about to become vacant) where an employer is taking specific actions to fill these positions.
Personal Consumption Expenditures PCE (headline and core): PCE deflators (or personal consumption expenditure deflators) track overall price changes for goods and services purchased by consumers. Deflators are calculated by dividing the appropriate nominal series by the corresponding real series and multiplying by 100.
University of Michigan Consumer Sentiment Index: Consumer confidence tracks sentiment among households or consumers. The results are based on surveys conducted among a random sample of households. Target Audience: representative sample of US households (excluding Alaska and Hawaii). Surveys of Consumers collects data on consumer attitudes and expectations summarized in the Consumer Sentiment, in order to determine the changes in consumers' willingness to buy and to predict their subsequent discretionary expenditures. This Index is comprised of measures of attitudes toward personal finances, general business conditions, and market conditions or prices. Components of the Index of Consumer Sentiment are included in the Leading Indicator Composite Index. Unit: Index (Q1 1966=100).
Index Definitions
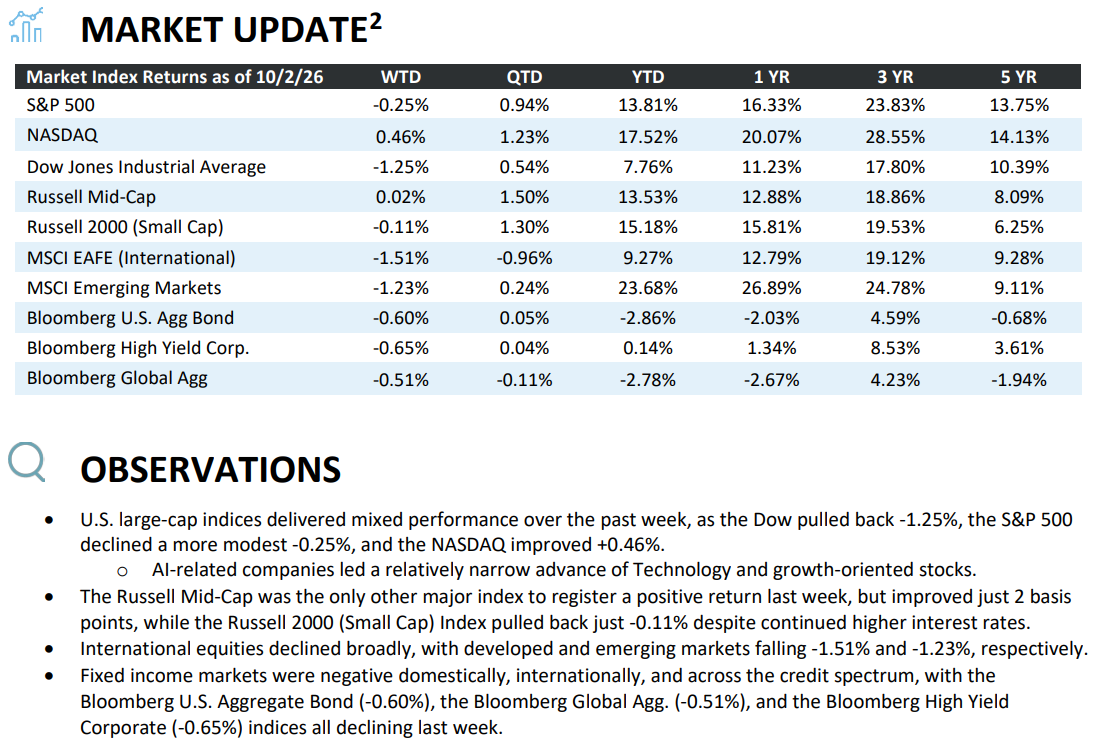
S&P 500: The S&P 500® is widely regarded as the best single gauge of large-cap U.S. equities and serves as the foundation for a wide range of investment products. The index includes 500 leading companies and captures approximately 80% coverage of available market capitalization.
NASDAQ: The NASDAQ Composite Index is a broad-based capitalization-weighted index of stocks in all three NASDAQ tiers: Global Select, Global Market and Capital Market. The index was developed with a base level of 100 as of February 5, 1971.
Dow Jones Industrial Average: The Dow Jones Industrial Average is a price-weighted average of 30 blue-chip stocks that are generally the leaders in their industry. It has been a widely followed indicator of the stock market since October 1, 1928.
Russell Mid-Cap: Russell Midcap Index measures the performance of the 800 smallest companies in the Russell 1000 Index, which represent approximately 25% of the total market capitalization of the Russell 1000 Index.
Russell 2000: The Russell 2000 Index is comprised of the smallest 2000 companies in the Russell 3000 Index, representing approximately 8% of the Russell 3000 total market capitalization. The real-time value is calculated with a base value of 135.00 as of December 31, 1986. The end-of-day value is calculated with a base value of 100.00 as of December 29, 1978.
MSCI EAFE: The MSCI EAFE Index is a free-float weighted equity index. The index was developed with a base value of 100 as of December 31, 1969. The MSCI EAFE region covers DM countries in Europe, Australasia, Israel, and the Far East.
MSCI EM: The MSCI EM (Emerging Markets) Index is a free-float weighted equity index that captures large and mid-cap representation across Emerging Markets (EM) countries. The index covers approximately 85% of the free float-adjusted market capitalization in each country.
Bloomberg Barclays US Agg Bond: The Bloomberg Barclays US Aggregate Bond Index is a broad-based flagship benchmark that measures the investment grade, US dollar-denominated, fixed-rate taxable bond market. The index includes Treasuries, government-related and corporate securities, MBS (agency fixed-rate pass-throughs), ABS and CMBS (agency and non-agency).
Bloomberg Barclays High Yield Corp: The Bloomberg Barclays US Corporate High Yield Bond Index measures the USD-denominated, high yield, fixed-rate corporate bond market. Securities are classified as high yield if the middle rating of Moody's, Fitch and S&P is Ba1/BB+/BB+ or below. Bonds from issuers with an emerging markets country of risk, based on Barclays EM country definition, are excluded.
Moody's, Fitch and S&P is Ba1/BB+/BB+ or below. Bonds from issuers with an emerging markets country of risk, based on Barclays EM country definition,
are excluded.
Bloomberg Barclays Global Agg: The Bloomberg Barclays Global Aggregate Index is a flagship measure of global investment grade debt from twenty-four local currency markets. This multi-currency benchmark includes treasury, government-related, corporate and securitized fixed-rate bonds from both developed and emerging markets issuers.
Bloomberg Barclays Municipal Bond Index: The Bloomberg Barclays U.S. Municipal Index covers the USD-denominated long-term tax-exempt bond market. The index has four main sectors: state and local general obligation bonds, revenue bonds, insured bonds and prerefunded bonds.
|