Volume 242 | August 29, 2025


Guardian Asset Management

Weekly Newsletter

Guardian endeavors to provide you with the latest in housing, industry and market news from Washington D.C. and around the country. It is our goal as your industry partner to be informative, relative and topical.

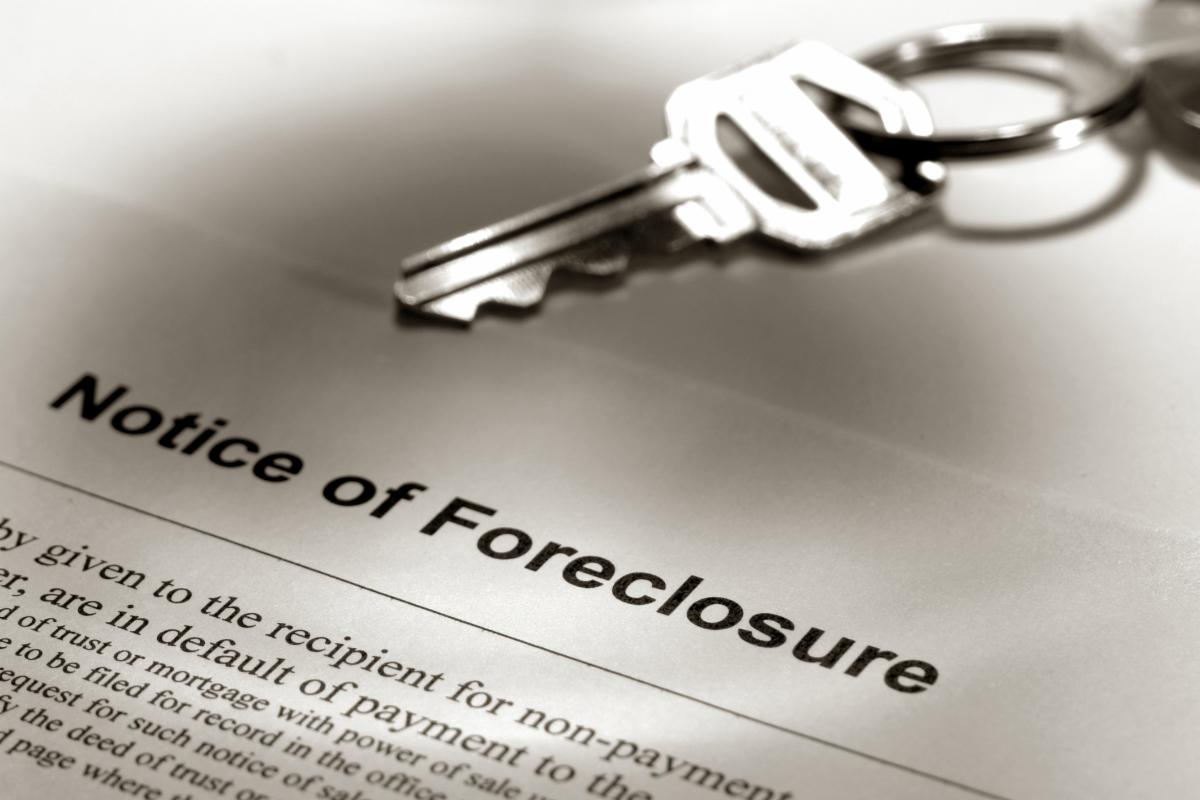
Foreclosure Starts Jumped in July as Mortgage Delinquencies Ebbed

Foreclosure starts jumped 4.3% in July compared with June and were up 7.61% compared with July 2024, according to ICE Mortgage Technology’s First Look report.


There were about 32,000 foreclosure starts nationwide for the month, according to the firm’s data.


In addition, foreclosure sales surged 9.68% to reach 6,900 for the month. That’s up about 25% year-over-year.


As of the end of the month the foreclosure pre-sale inventory rate was about 0.38%, a decrease of about 0.62% compared with the previous month but up about 8.1% compared with a year earlier.


There were about 207,000 residential properties in the foreclosure pipeline, down about 1,000 compared with June but up about 19,000 compared with July 2024.


Delinquencies, meanwhile, dropped to a rate of 3.27%, down about 2.47% compared with the previous month and down about 2.82% compared with a year earlier.


‘Canary in the Coal Mine’:

How Rising Consumer Debt Could Signal Mortgage Troubles


Despite reports that consumer debt delinquencies have been on the rise, this trend hasn’t been reflected in mortgage delinquencies, which remain very low by comparison.


However, mortgage delinquencies are starting to rise as household budgets feel the squeeze of rising consumer debt and inflation. One credit bureau decided to see if it could find a correlation between the increasing burden and the likelihood of future mortgage delinquency.


TransUnion released the results of its survey on Thursday, which was conducted among 57 million mortgage customers. The results showed a direct correlation between a rise in consumer payment-to-income (PTI) ratios and future mortgage delinquency.

Investors Hold Most Empty Houses


Investors owned more than 882,300 vacant houses as of last year’s third quarter, according to the latest report from ATTOM Data Solutions.


That’s a scant 3.6% of the 24.9 million properties held by investors nationwide. But it’s a major portion of the nearly 1.4 million total residential properties that had no occupants at the end of September 2024. It’s also almost three times the 1.3% of all houses that are empty.


The states with the highest vacancy rates in investor-owned properties were: 

  • Indiana (7.2%); 
  • Illinois (6.1%); 
  • Oklahoma (5.9%); 
  • Alabama (5.9%); and 
  • Ohio (5.8%). 


States with the lowest vacancy rates were: 

  • New Hampshire (0.9%); 
  • Vermont (1%); 
  • Idaho (1.2%); 
  • Utah (1.5%); and 
  • North Dakota (1.5%).


ATTOM’s report analyzes publicly recorded real estate data collected by the analytics firm, including foreclosure status, equity, and owner-occupancy status.

Gen Z, Millennials Struggle With Housing Costs

Over 40% of millennial and Gen Z homeowners claim they struggle to afford their regular housing payments, a substantial number but less than the 70% who are saying the same about their rent, a Redfin survey found.


In May, a survey conducted by Ipsos for the real estate company had over 4,000 homeowners and renter responses. This latest report looks at the nearly 2,000 people who said they have issues with being able to pay their housing costs.


Among the issues plaguing homeowners in particular are the rising costs of property taxes and insurance. But renters do not pay property taxes and if they have the coverage, renter insurance premiums are lower than owner policies.


Survey respondents were considered to have an issue if they made one of the following selections in the survey: "I struggle greatly to afford them;" "I regularly struggle, but sometimes okay;" or "I sometimes struggle, but generally okay." 


Report: 2025 Buyers Need Big Rate Drop

to Benefit From Refinancing


As US mortgage rates continue to hover near 7%, many 2025 homebuyers are finding that refinancing may not pay off unless rates fall more steeply than expected. A new report released Wednesday by Neighbors Bank shows that most borrowers would need at least a 0.75 percentage-point drop in rates to break even within three years. 


The analysis modeled typical refinance scenarios across all 50 states, using a 30-year fixed-rate mortgage at 6.8% with an average loan amount of $386,339 and closing costs of $5,458. Smaller decreases of 0.25 or 0.5 points failed to deliver meaningful short-term savings. 


According to the report, a 0.25-point drop would leave borrowers about $2,424 in the red after three years. A 0.5-point reduction would reach break-even at just over three years, while a 0.75-point decline would cross the threshold in under three years. A full one-point drop in rates could lead to break-even in 20 months, with net savings of $4,764. 


Mortgage Delinquencies Ease in July, but Foreclosure Inventory Swells: ICE


The U.S. mortgage delinquency rate (loans 30+ days past due, but not in foreclosure) strengthened to 3.27% in July, down nine basis points from a year ago and 58 bps below its pre-pandemic levels, according to Intercontinental Exchange's First Look report published Monday.


Serious delinquencies, or loans 90+ days past due but not in foreclosure, rose by 30K Y/Y to 466K in July. Even so, that's the smallest annual gain since November, as the impacts from recent wildfires and last year’s hurricanes continued to fade.


Meanwhile, FHA loan delinquencies, accounting for 52% of serious delinquencies, rose 15 bps Y/Y


“If you are looking for signs of a faltering economy, you won’t find them in July’s mortgage performance data,” said Andy Walden, head of Mortgage and Housing Market Research at ICE. “New delinquency inflows were down -13% from June and -5% from the same time last year, with the national delinquency rate improving on an annual basis for the second straight month, breaking what had been a 13-month streak of consecutive increases.”


Still, the total number of homes that were in the foreclosure process climbed 10% from a year earlier in July, with the initiation of new foreclosures rising annually for eight consecutive months and foreclosure sales up in each of the last five months. But the national foreclosure rate trailed its 2019 mark by 35%.