|
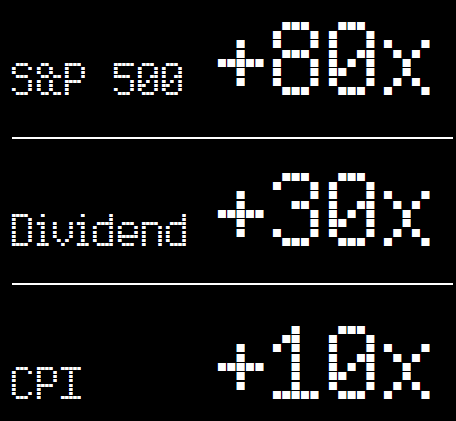
This is the 62 year score card of equities versus the cost of living:
• Where did the S&P 500 close out 2025 compared to
where it ended in 1964?
• to those clients who are
stepping into retirement: how much did the S&P 500
pay out in cash dividends last year versus 1964?
• And how did both price performance and dividend
payments compare to consumer inflation or cost of living—which,
in a two-person three-decade retirement, will be what
matters most?
The answers are suitably consistent:
• The S&P 500 closed out 1964 at 84.75. It ended
this past year at 6,845.50.
• The cash dividend paid out in 1964 was $2.58. In
2025 it was $78.50.
• The Consumer Price Index ended 1964 at 31.3. It
ended 2025 at 326.
disclosure: These views are those of the author, not of the broker-dealer or its affiliates. This material contains an assessment of the market and economic environment at a specific point in time and is not intended to be a forecast of future events, or a guarantee of future results. All investments involve risk, including loss of principal. Forward-looking statements are subject to certain risks and uncertainties. Actual results, performance, or achievements may differ materially from those expressed or implied. Information is based on data gathered from what we believe are reliable sources.
Dividend payments are not guaranteed and may be reduced or eliminated at any time by the company.
The Consumer Price Indexes (CPI) program produces monthly data on changes in the prices paid by urban consumers for a representative basket of goods and services (Source: U.S. Department of Labor).
All indexes referenced are unmanaged. The volatility of indexes could be materially different from that of a client’s portfolio. Unmanaged index returns do not reflect fees, expenses, or sales charges. You cannot invest directly in an index. Consult your financial professional before making any investment decision.
|