Key Details:
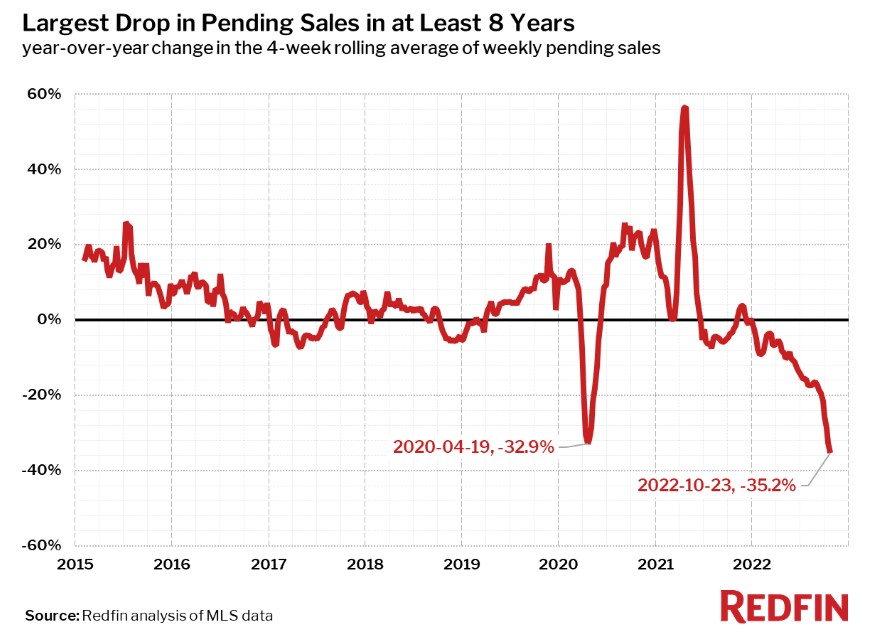
- Pending sales are down 35% year over year
- That drop is the biggest in at least eight years
- Home showing traffic is down 17% year over year
Pending home sales and home showing traffic are still on a downward slide, thanks to higher mortgage rates and punishing inflation.
According to a new Redfin report, pending home sales for the four weeks ending October 27 are down 35.2% compared to a year ago—the biggest annual decline since January 2015, which is as far back as Redfin’s data goes.
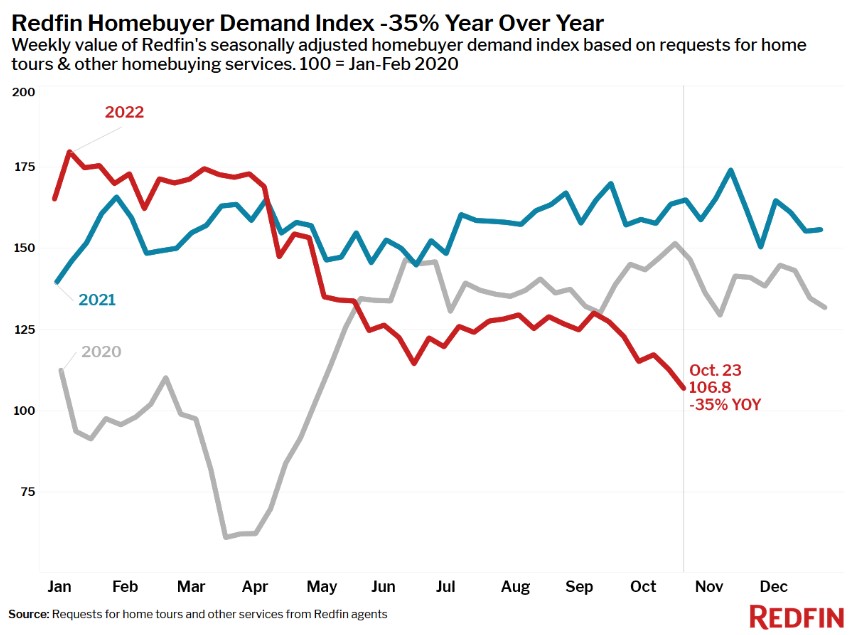
In addition, new data from the ShowingTime® Showing Index shows a year-over-year decline of 17% in home showing traffic—another sign of cooling buyer demand due largely to inflation and higher mortgage rates.
MONTH-OVER-MONTH DECLINES IN PENDING HOME SALES
The Pending Home Sales Index (PHSI) — described by NAR as a “forward-looking indicator of home sales based on contract signings” — dropped to 79.5 in September.
Breaking it down by region, NAR found:
- The Northeast PHSI dropped 16.2% month over month to 64.2—30.1% lower than September 2021.
- The Midwest index dipped 8.8% month over month to 80.7—down 26.7% from a year ago.
- The South index declined 8.1% month over month to 97.0—30.0% lower than a year ago.
- The West index faded by 11.7% month over month to 62.7—down 38.7% from the same time last year.
HOME SHOWING TRAFFIC STILL DECLINING
ShowingTime’s data shows a continuing decline in home showing traffic, which is (so far) still above pre-pandemic norms. Showing activity in September dropped 17% year over year.
All regions and the U.S as a whole saw month-to-month and annual drops in home showing traffic, with the Western region, in particular, seeing a 45% year-over-year decline.