Tick Season


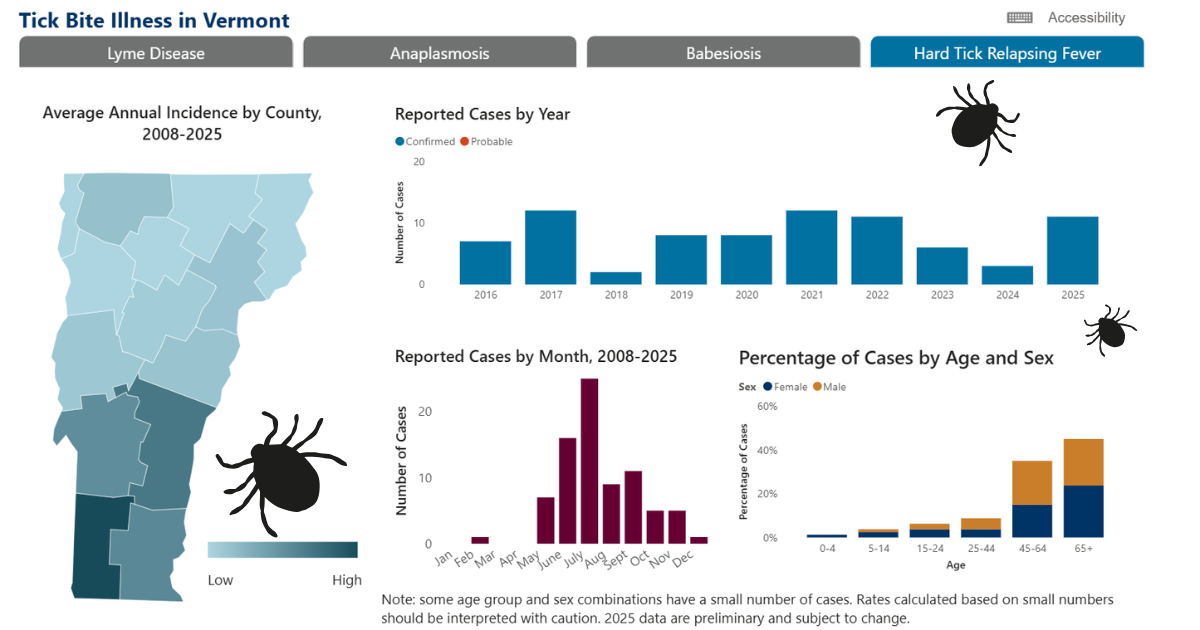
You check yourself for ticks...but have you checked out the Tick Bite Illness dashboard? Vermont Tracking works with the Health Department's Vectorborne Disease program to track cases of Lyme disease, anaplasmosis, babesiosis and now hard tick relapsing Fever, which had 11 confirmed cases in Vermont last year.


All cases of tick bite illnesses peak in July on average, but ticks are still active until winter. The best way to prevent tick bite illness is to prevent tick bites by avoiding the wooded and brushy areas where they live, wearing protective clothing and gear, using insect repellent and making sure pets don't bring ticks into your home.


Report and Track Cyanobacteria Blooms

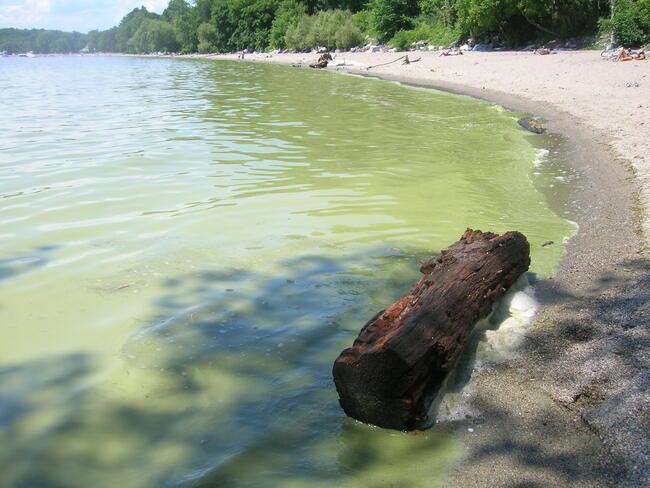
Photo of a cyanobacteria bloom

August might feel like the end of summer, but there are still lake days to be had! From June to early October, volunteers from the Lake Champlain Committee monitor sites across Vermont for cyanobacteria. The Cyanobacteria Tracker shows their weekly reports in an easy-to-navigate map.


While the map displays recent reports, conditions can change quickly - and not every swimming area in the state is monitored. Know how to spot a cyanobacteria bloom (it can look like split pea soup!), check your local swim area's website or social media for closures, and remember to practice water safety wherever you're making a splash.


If you see a bloom, stay out of the water. Instead, snap a few pictures and report it to the tracker so we can add it to the map!


Heat-related Illness Data

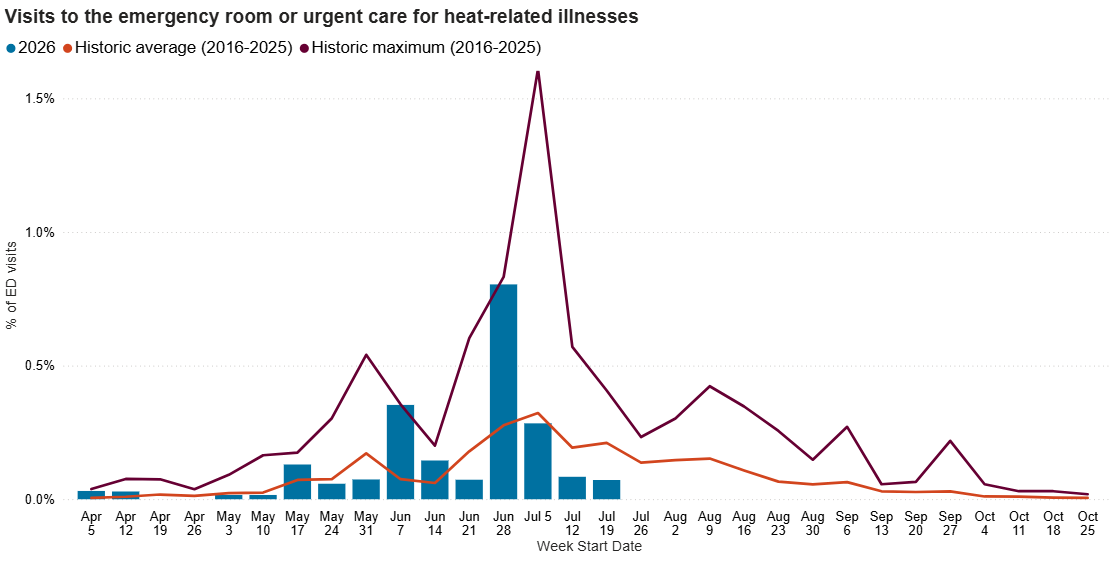
Screenshot of the heat-related illness bar chart with visits to the ED spiking the week of June 28.

Hot summer days can lead to heat-related illnesses like heat exhaustion or heat stroke. We see this in our near real-time data for heat-related illness visits to the emergency room or urgent care: visits spiked during the heatwave at the end of June, which aligns with the historic average and maximum values seen at this time of year.


Heat disproportionately impacts some Vermonters, including unhoused people. To better understand how, the Health Department partnered with Middlebury College on the Heat & Houselessness Storytelling Project. Explore the interactive project to hear real experiences of unhoused people living with climate-related impacts and challenges.


The Health Department has many heat safety resources for communities, including a map of cooling sites, multilingual resources and guidance for community partners.

New Look for Tracking Reports

You may notice our data reports looking more streamlined over the next few months. We are making changes to make reports more accessible for all users through features like built-in reading order, keyboard navigation and higher color contrast. Reports will also be more visual with a focus on data and key points. Look out for these improvements as we strive to make Vermont's environmental public health data accessible for everyone!

About Environmental Public Health Tracking

The Vermont Tracking Program is part of a nationwide network of partners funded by the CDC. At the local, state, and national levels, the Tracking Program uses a network of people and information systems to deliver a core set of health, exposure, and hazards data, information summaries, and tools to enable analysis, visualization and reporting of insights drawn from data.

Follow Us!

Facebook  Instagram  LinkedIn  YouTube