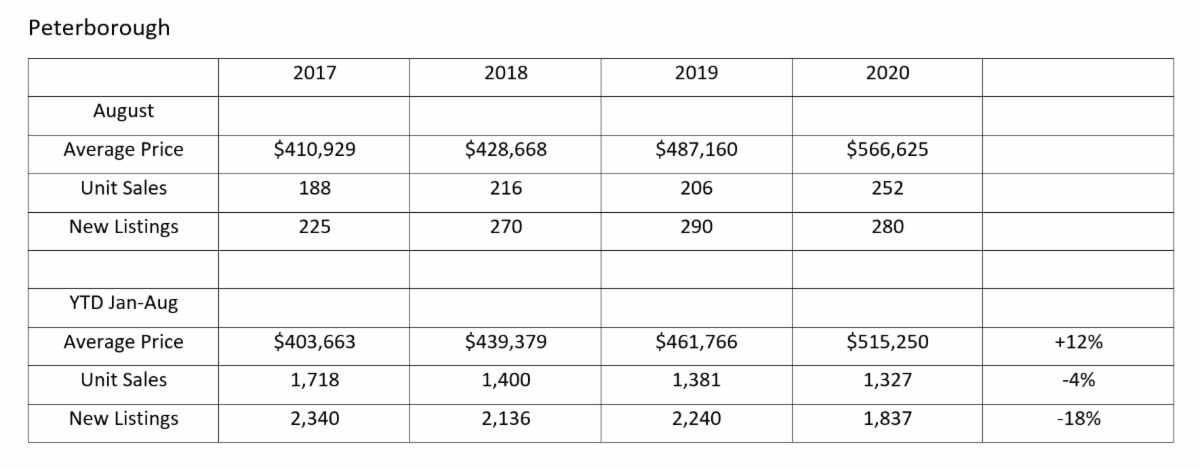
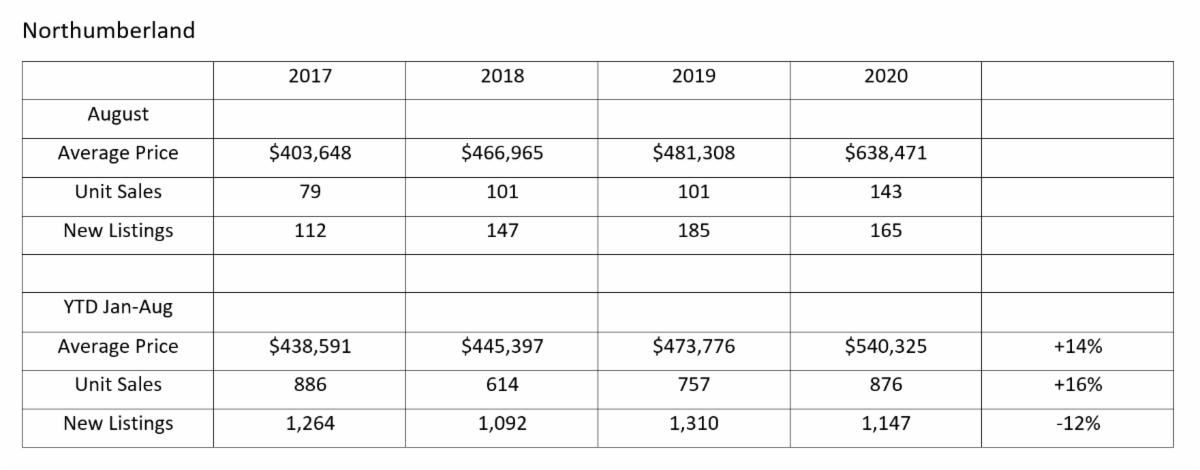
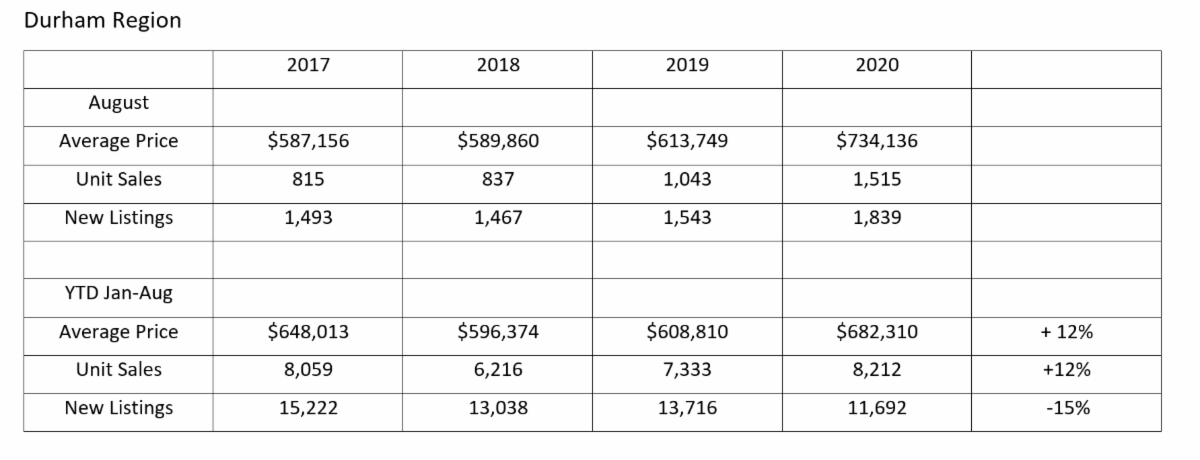
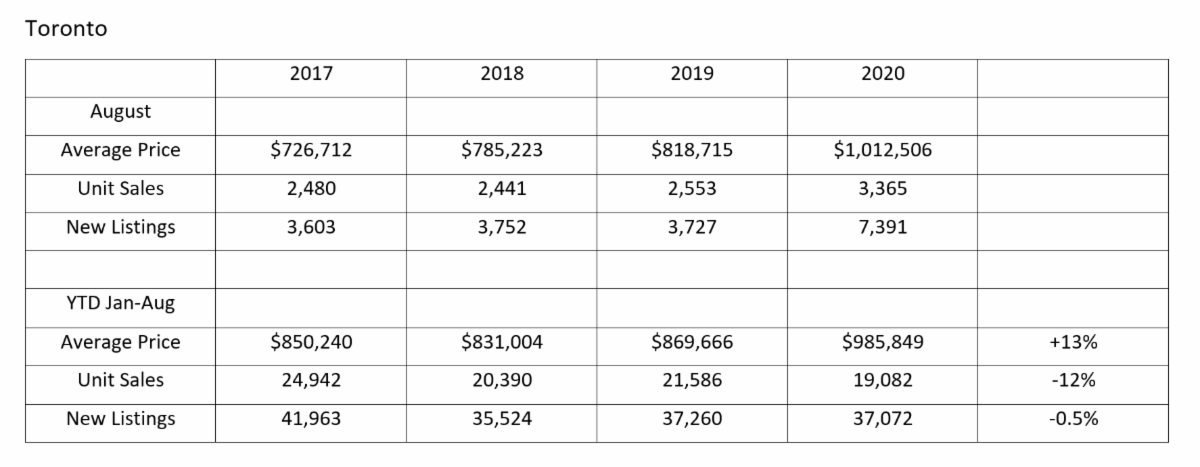
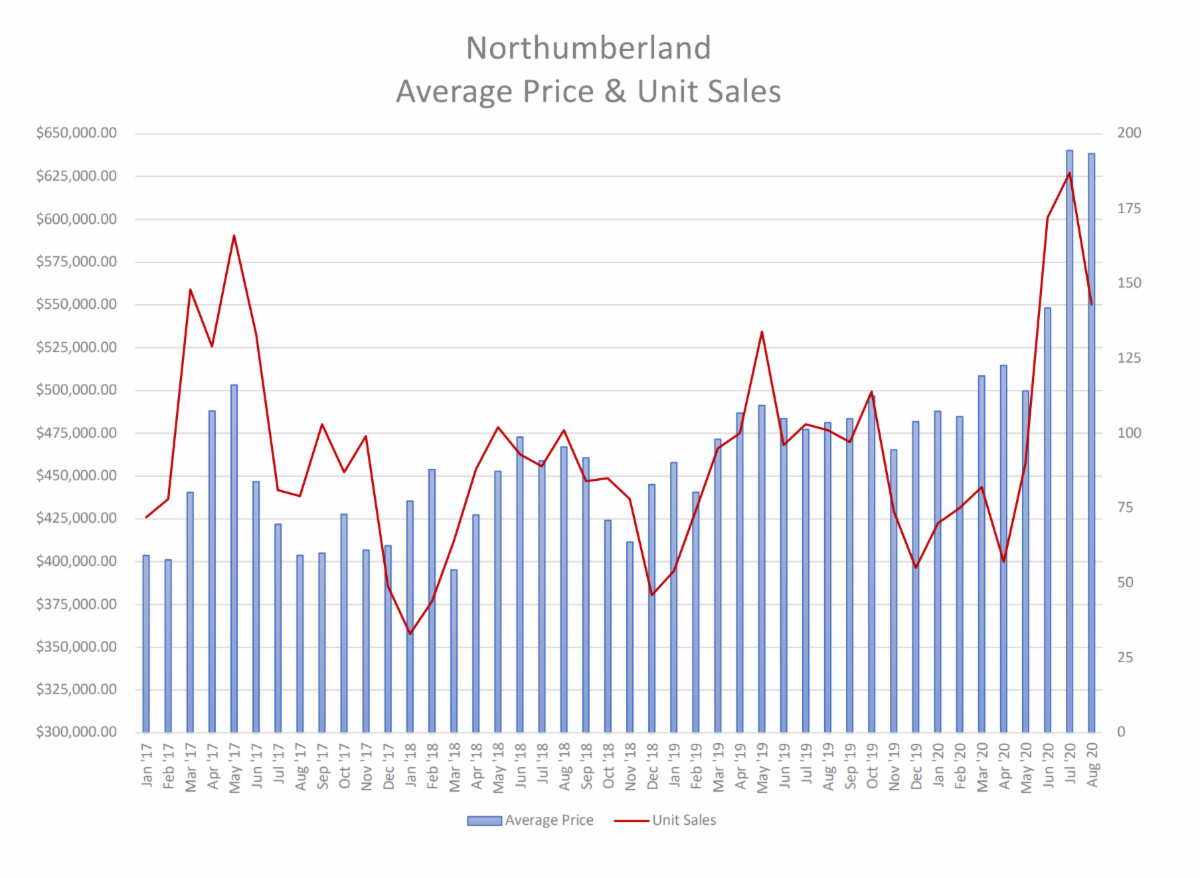
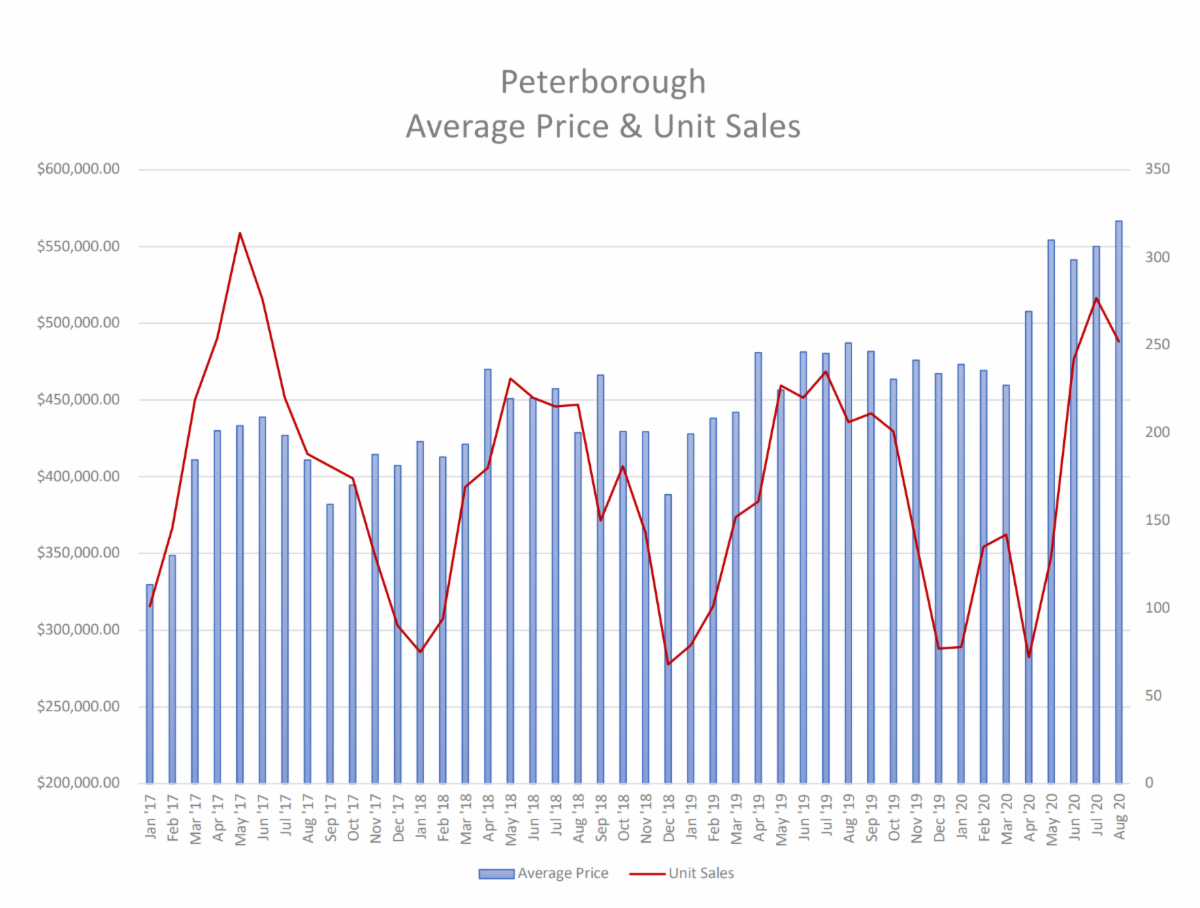
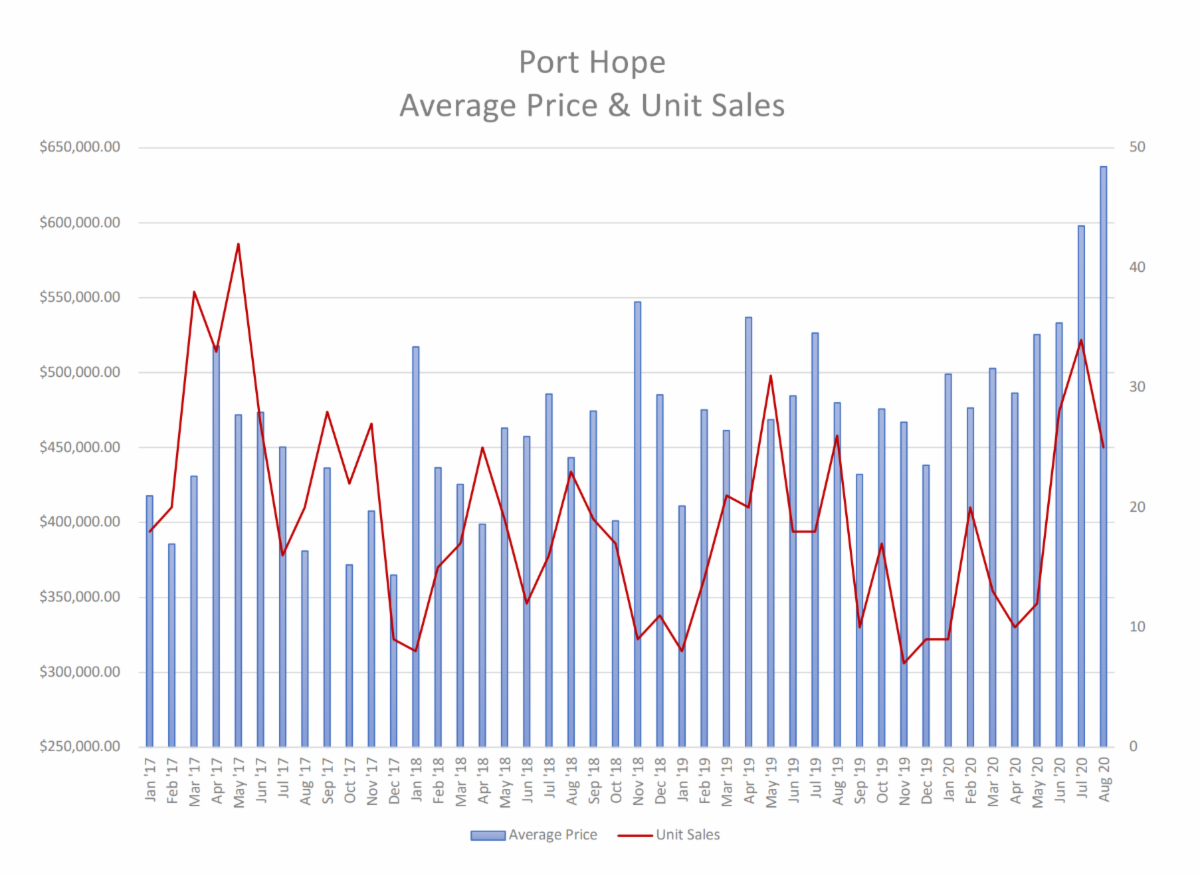
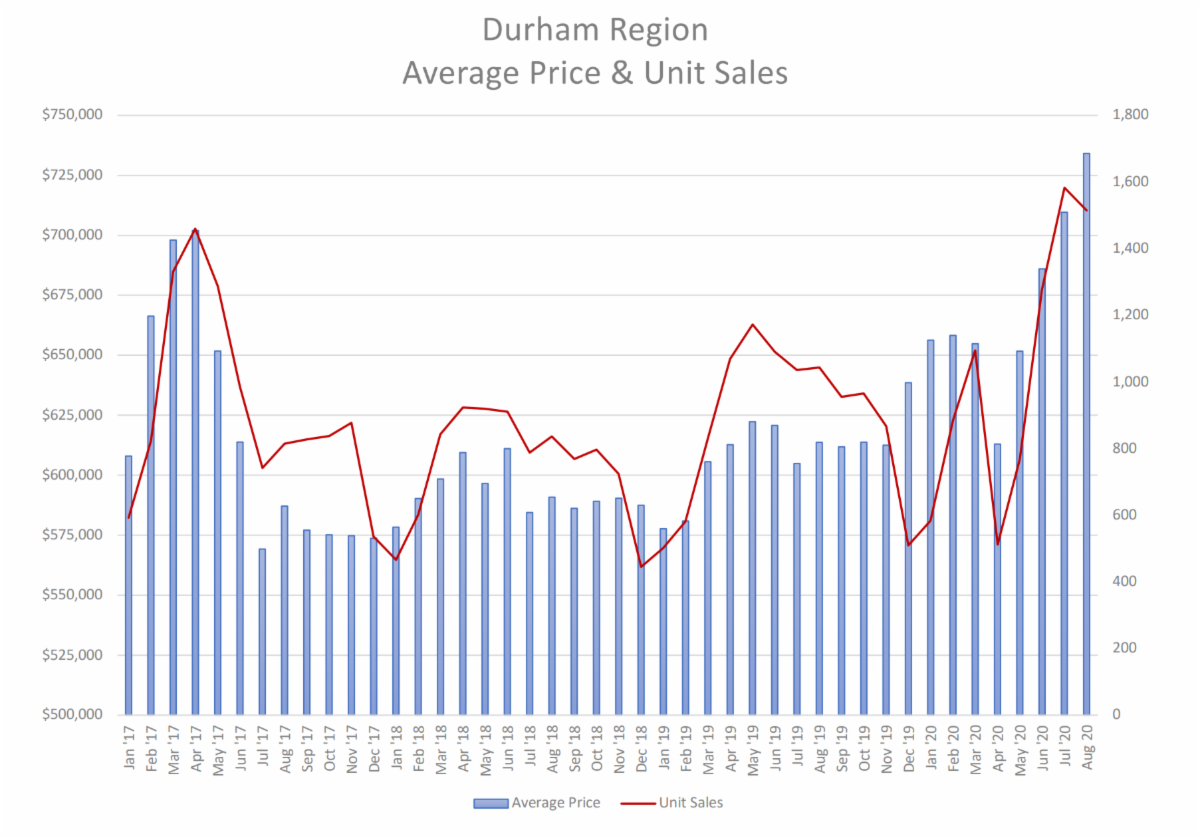
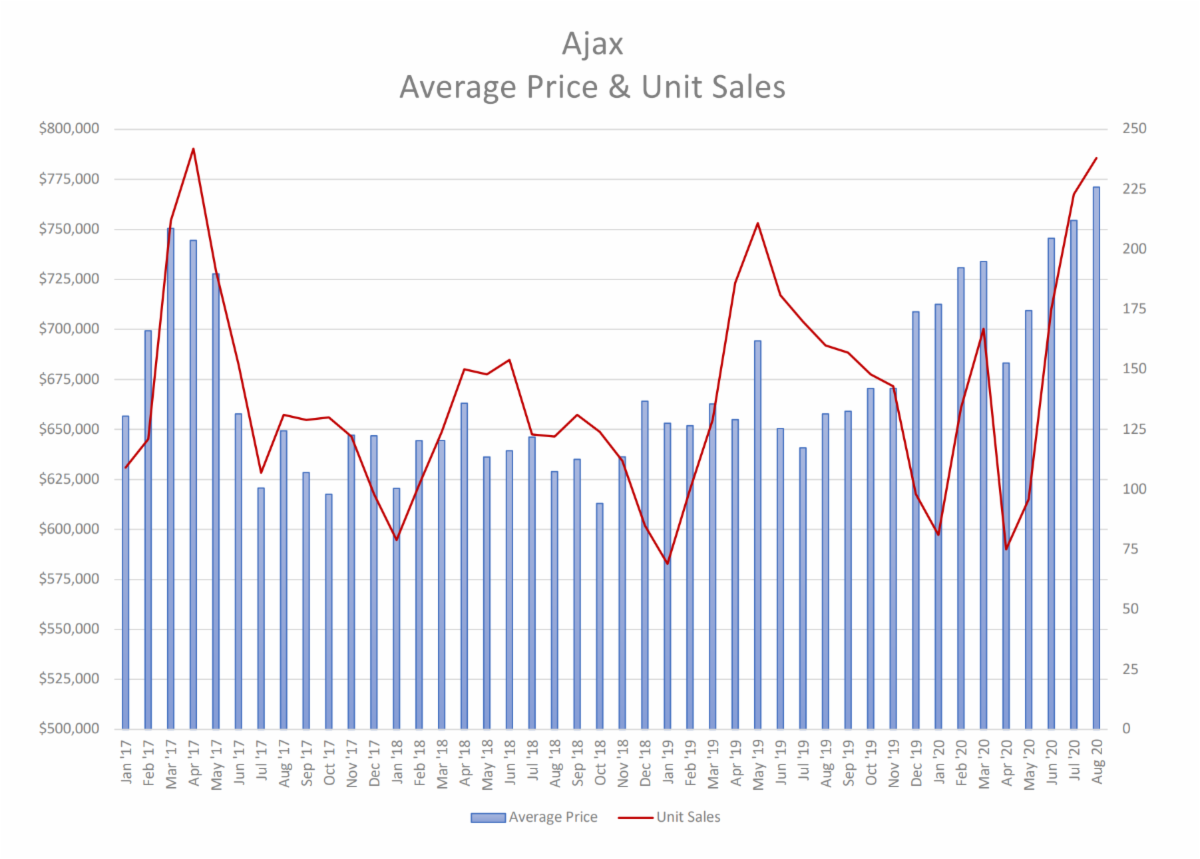
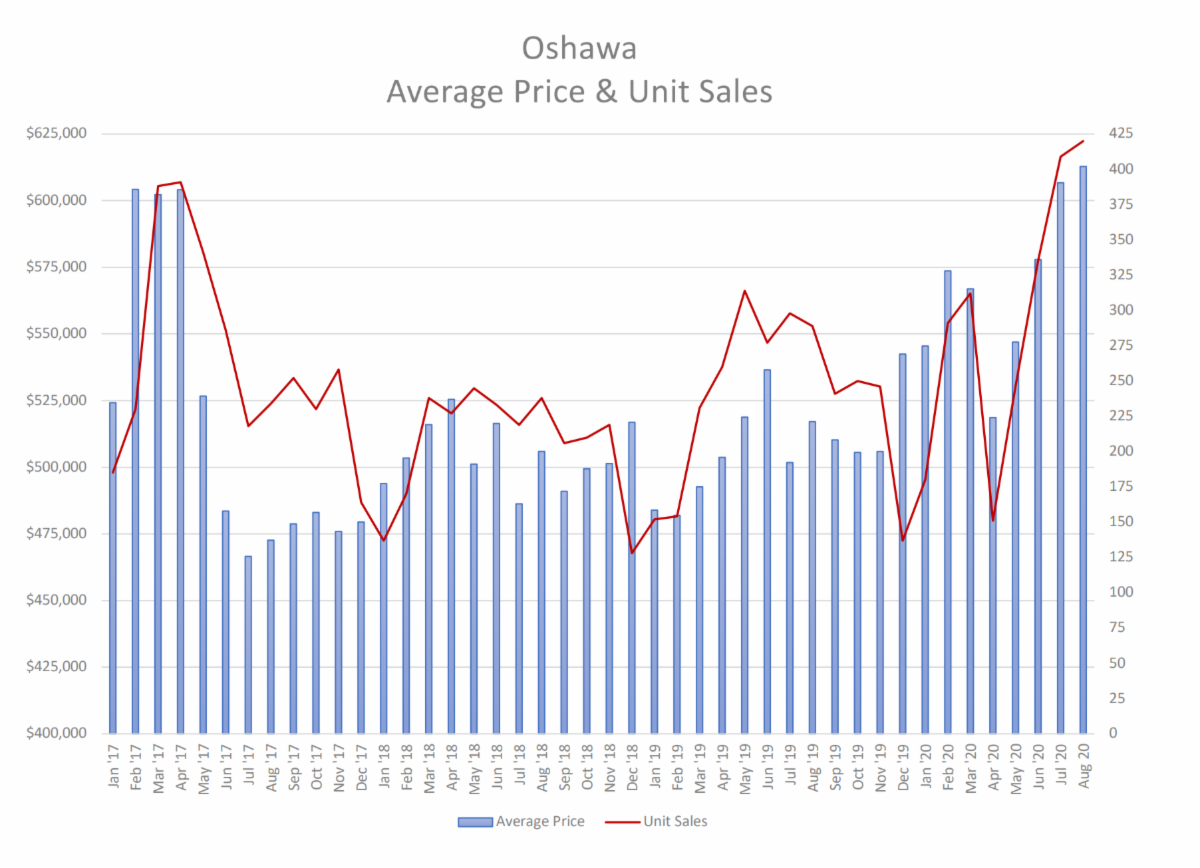
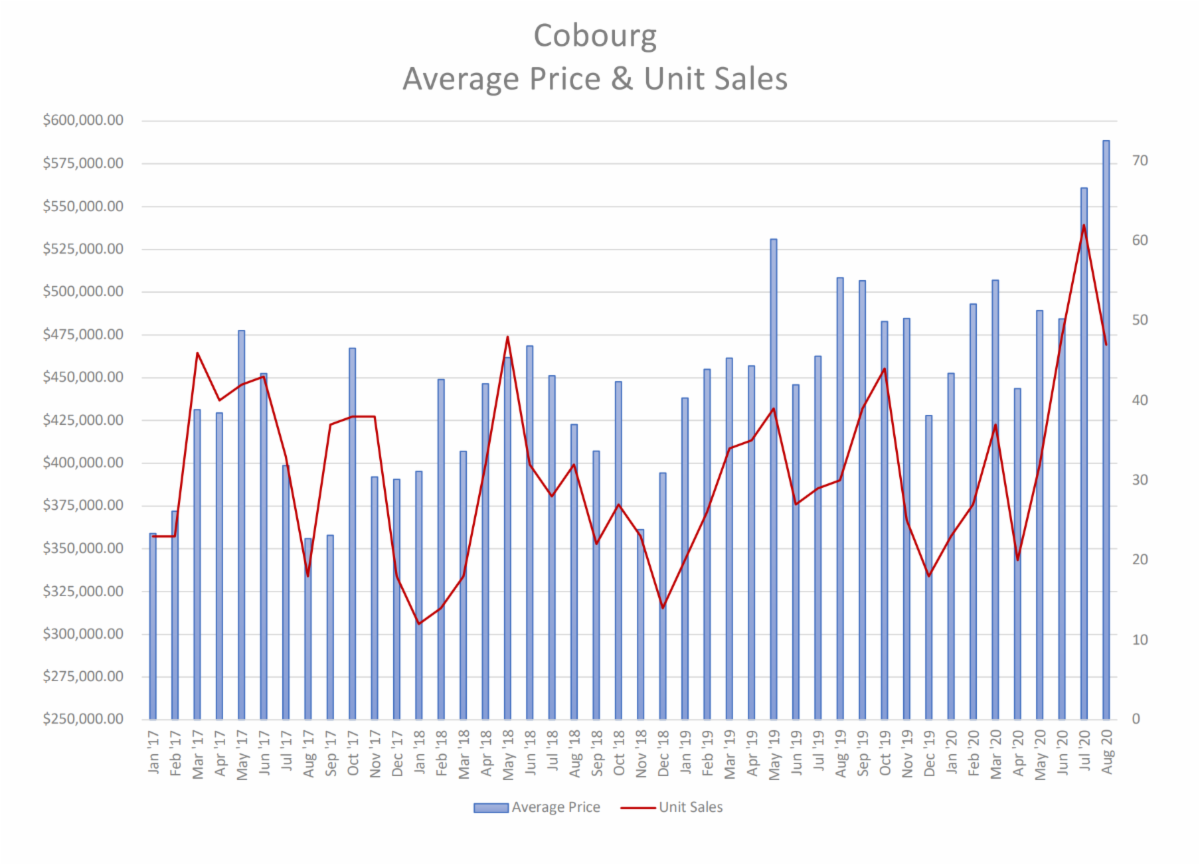
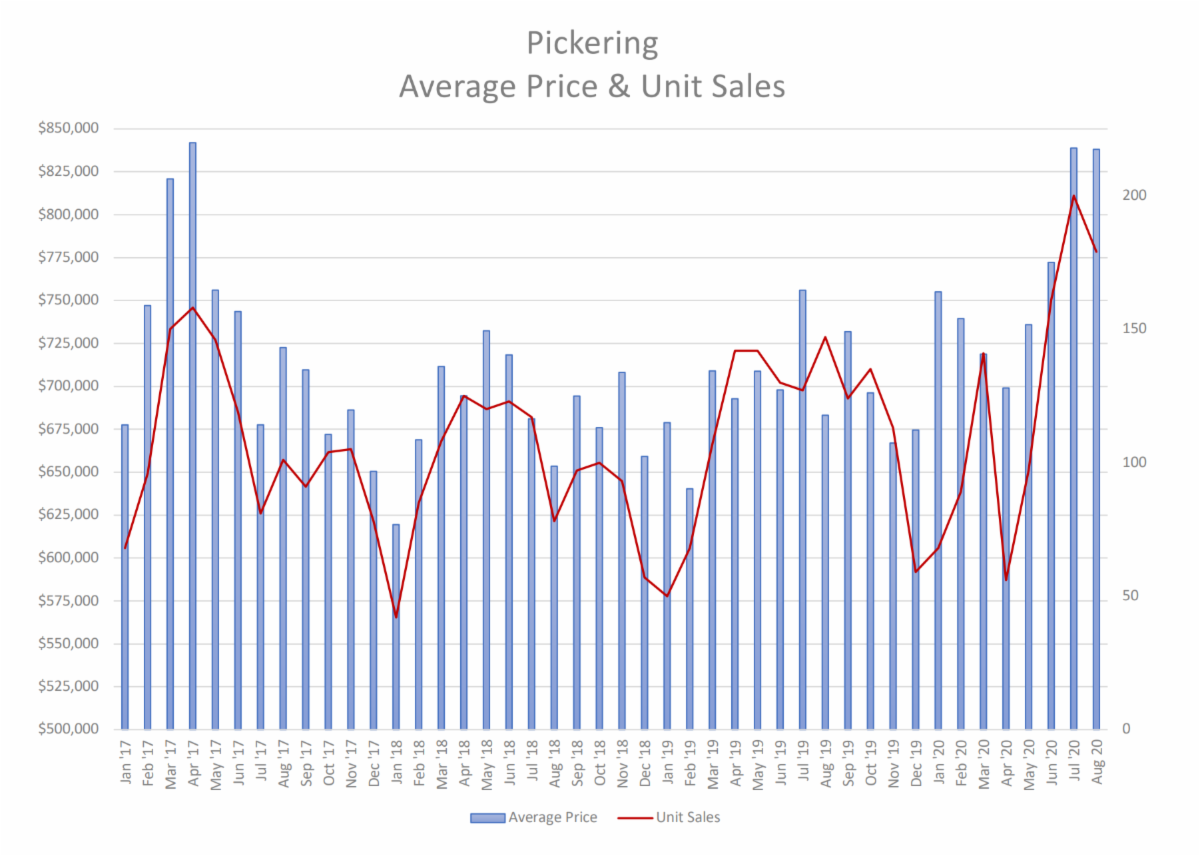
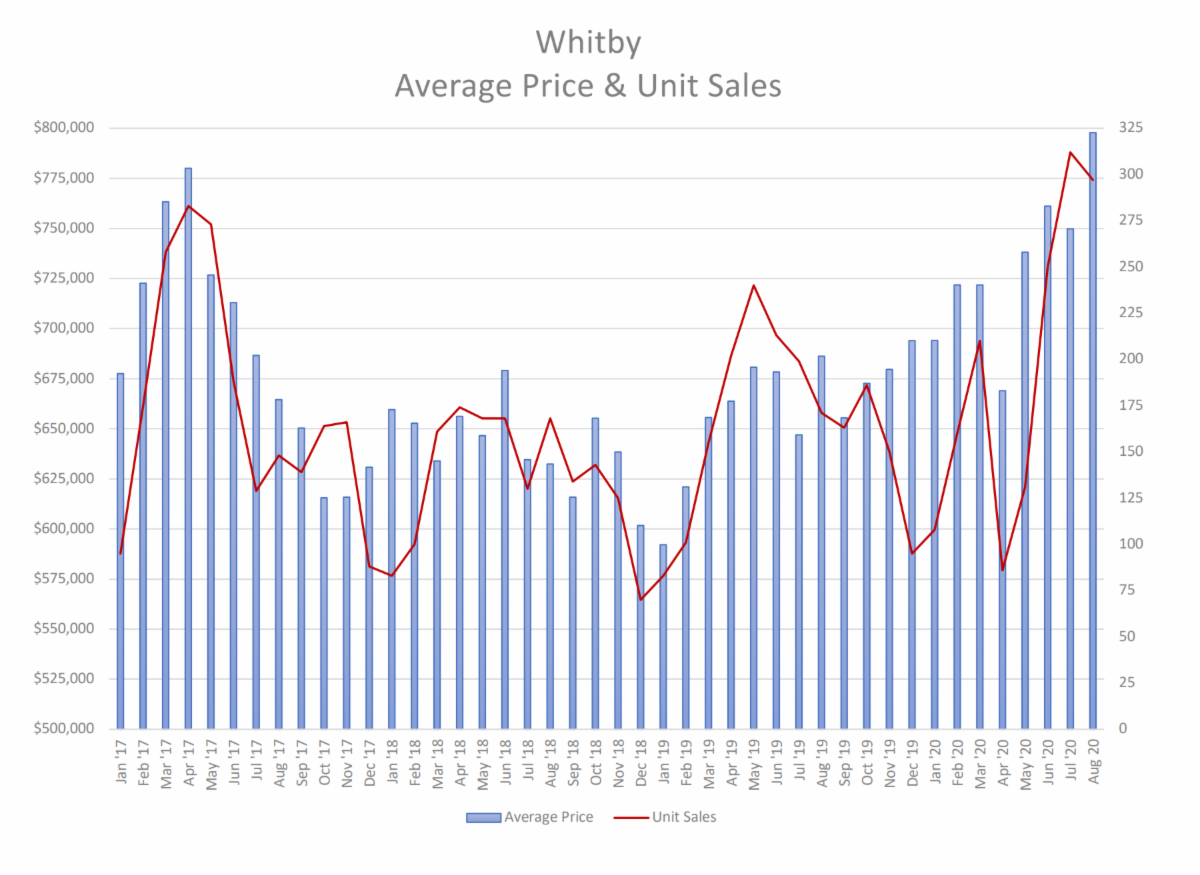
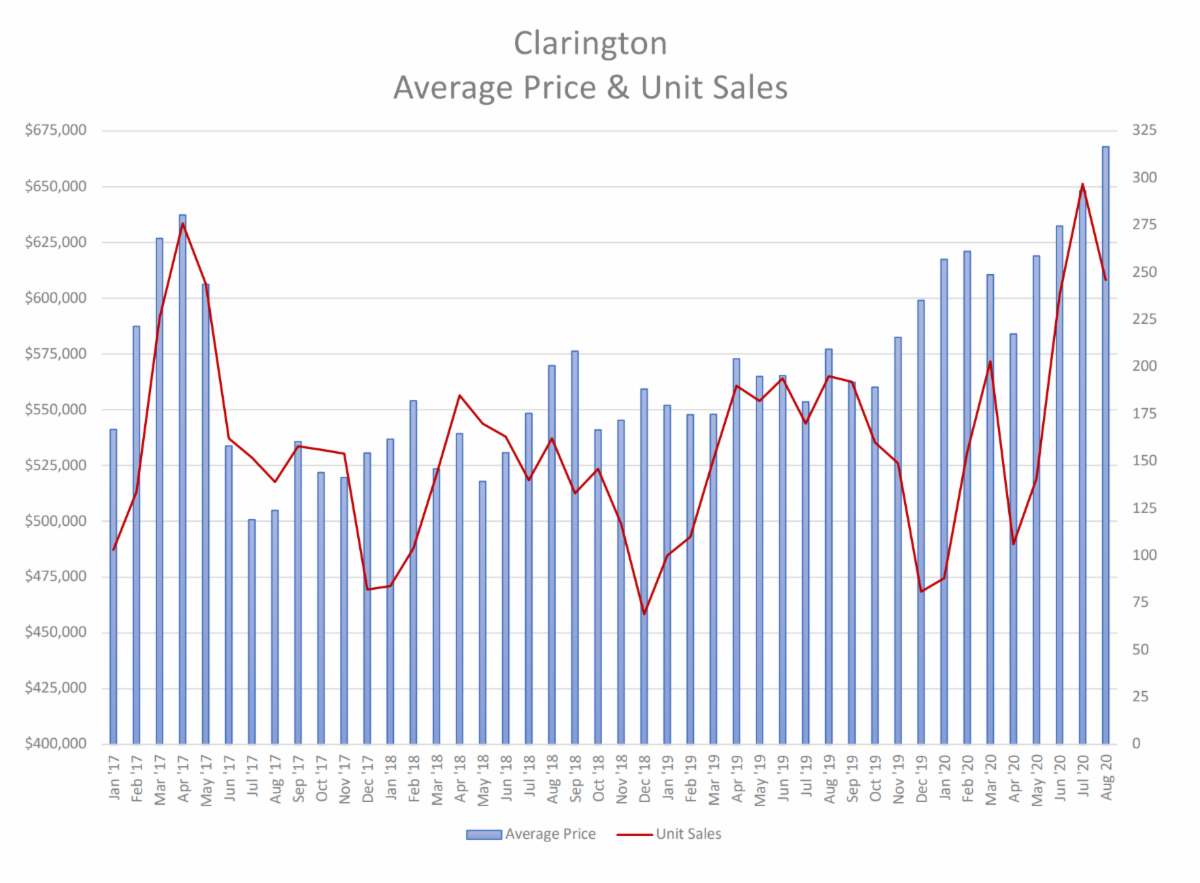
Monthly stats on a year over year comparison provide a specific snapshot of market activity and often create misconceptions and misundersanding.
It's important to understand market trends and activity over the long term as well as short term so that you can properly analyze and interpret effectively for your clients.
Notwithstanding the recent attention grabbing headlines of 40 - 45% increases in sales activity across the GTA (August 2019 v August 2020) - when we look at market activity for the year to date (January - August 2019 vs January - August 2020) the results are quite different. There are very healthy gains across the board but not as startling as recent headlines would suggest.
Market activity based on an August year over year comparison does not take in account current global and local economic and social conditions in the unprecedented landscape of 2020.
Low inventory continues to drive the market and push the average sale price up. As inventory grows over the next two quarters, supply will outpace demand and we will likely shift back into a Buyer's market by early 2021.
It's too early to gauge and/or predict how recent social distancing measures and potential future measures imposed will affect the real estate market in the coming months and years. What we do know is that TODAY - with low interest rates, strong consumer confidence, Realtor innovation and skill to quickly adapt to new sales stratgies - is a GREAT TIME to buy and sell real estate.