THE BRICK
Hudson Valley News and Market Report
November, 2020
|
|
What a ride and it’s not over – with 865 contract deals in Dutchess County yet to close. The numbers in this report will adjust accordingly post-closing, but there is enough data available now for sound perspective on what to expect year-end by town. The Brick subscriber base enjoys an advance peek. Here we go… |
|
Slump to Rally
After a Covid-19 induced second quarter slump with Dutchess down 16% in closed sales, the real estate industry caught tailwinds and posted a huge comeback quarter. This is not just in our county, but nationwide. According to a report just released by Redfin, the demand for second homes throughout the nation has increased 100 percent year over year. The demand for primary homes has risen by 50 percent. In case you’re curious, the top spots in the nation for second homes as reported by Redfin are Lake Tahoe, Cape Cod, Palm Springs, the Jersey Shore, and Bend, Oregon.
In Dutchess County, sales volume year over year as reported in the Mid-Hudson multiple listing service is up 15%. Steven Domber, President Berkshire Hathaway Home Services Hudson Valley Properties (“BHHSHVP”) doubled that number and announced 30% sales volume increase year over year for BHHSHVP. The average sale price is up 20% over last year, but the average is skewed by high-end sales. 41 houses over $1M sold in Dutchess January 2020 to October 31, 2020 with only 17 homes $1M+ selling during the same period in 2019. With that being the case, it seems just to consider the median. The median increase January-October 31, 2020 is 9.2%, which is still a healthy bump year over year. The year over year median for the same period in Westchester is 10.1%. The median specific to Q3 was not available through Mid-Hudson MLS at this time, but the median in Westchester for Q3 was 16%. Based on activity and alignment with Westchester numbers, a sound approximation for Dutchess County Q3 median increase year over year is 15%. See Westchester and Putnam County Reports for more info. Ulster and Columbia County were contacted for stats but were not able to provide prior to email distribution.
There are three main factors that drive the real estate market: interest rates (affordability), inventory (availability) and local economy. The interest rates have been holding favorably for buyers, increasing buying power. Inventory was already tight in certain price points throughout the county before Covid-19 hit. However, the current demand catapulted a strong sellers’ market, which continues. While unemployment has risen from 3.9% in February to current 7.9%, it is still considered to be contained. While there is a decrease in overall sales volume year to date, the City of Poughkeepsie is poised for positive impact on the local economy. With train accessibility and new construction on tap that includes, but is not limited to, 1300 housing units, multiple thousands of square feet in commercial space and the hospital extension nearing open, POK is watch worthy and should support continued growth throughout the county.
Click here to see the market momentum reports for the Town and City of Poughkeepsie or view full county market momentum reports by town by clicking here.
|
|
How slow is slow?
Absorption rates are fluid. As new listings enter the market and other listings move to contract then to sold, absorption rates will shift up or down accordingly. My clients have all sold at or above asking price year to date. This is far from the case with all listings. To mix reality in with the hoopla, I have included the current slowest moving price points per town. The months until absorbed (sold) back into the market noted are based on the combination of active, contract and sold listings in all price points. Click here to see the slowest moving price points by town.
|
How high is high?
The circa 1840 house on 8 bucolic acres in Red Hook spotlighted in the last issue of The Brick is now in contract (click here to see the listing.) That house checked coveted boxes for certain. I knew it would, but rather than push for offers and risk buyers with cold feet a few days later, my client agreed to a different strategy for the sale. I can’t disclose the sale price until closing, but I can say the over ask on this house will most likely set a record for residential resale in Dutchess County at this price point. Curious how this sale was handled different than norm to yield such success? Read the press release.
|
Was this newsletter forwarded to you? Join The Brick community and receive upcoming issues. |
|
How quick do you think this will sell?
It’s important to have a pulse on all aspects of the market when pricing and setting realistic client expectations. Absorption rates are a key factor sought from the market momentum reports I produce. Absorption is the amount of time it takes for a house to move from listed to absorbed back into the market (sold). The rate of absorption is a direct indicator of whether it’s a seller, buyer or neutral market. Historically speaking, if homes are largely absorbed (sold) within five months of being put on the market, it is indicative of a sellers’ market (read: we are definitively in one.) Six to seven months is generally a balanced market. Eight months or more is a buyers’ market. The Town of Stanford stands out with an impressive clean sweep in absorption rates that are five months and below in all price points up to $1,000,000; January 2020 through November 2020.
So what towns are the quickest to move these days, as indicated by their overall absorption rates between January 2020 and November 2020? The City of Poughkeepsie grabs the lead with an overall absorption rate of 2 months. East Fishkill along with the Town and Village of Fishkill tie for second place at 2.1 months. The next runner up is also a tie, between Hyde Park and the Town of Wappingers, each with an overall absorption rate of 2.7 months.
|
|
Market Momentum Reports
Town and County
These reports are not only foundational for my analysis in this newsletter, but also keep my pulse on the market for my clients. Beacon is not included, as the level of sales recorded outside of multiple listing services skews numbers beyond conclusive analysis.
Feel free to use these reports, but please acknowledge my work as they are time consuming to produce.
|
|
Who's the Fat Daddy?
Dutchess County beat Westchester County for highest sale year to date. In fact, there are multiple sales in Dutchess County that sold above the highest sale in Westchester County year to date. In Westchester, the highest sale was in Larchmont. The list price was $9,900,000. The estate sold for below asking at $8,650,000 in May, 2020.
Conversely, all three estates hitting top tier sales in Dutchess County sold over asking. For a singular sale, the Town of Red Hook continues as top dog with the sale of an Astor estate in April. The highest transaction in Dutchess in nearly a decade, the estate listed for $15,000,000 and sold for $16,500,000. Interestingly, it appears more than one buyer was at the table for all three top sales of the decade, all of which closed this year. The two-runner ups for highest singular sale January 2020 to November 2020 go to: 964 Huckleberry Road, Amenia listed for $7,900,000 and sold 11/2020 for $10,250,000 and 543 N. Mabbettsville, Millbrook, listed for $9,950,000 and sold 7/2020 for $10,250,000. Want to take a peek? See the Top Estate Sales for 2020.
Past a singular sale, The Town of Rhinebeck holds the “2020 Fat Daddy Mover Award.” Up a whopping 700% in sales volume 1/20-11/20 in the $1,000,000+ sector year over year. Between homes in contract and sold, the Town of Rhinebeck is slated to move SEVENTEEN $1,000,000+ homes versus ONE in 2019. With 16 more $1M+ homes in the hopper as active listings, the Town could now be poised to hit saturation in this price point as indicated by the current 20-month absorption rate. The $900,000-$1,000,000 price point in the Town of Rhinebeck is also up by 400%, with a more favorable 6-month absorption rate. In fact, with the exception of an inventory squeeze in the $800,000-$900,000 range, the Town of Rhinebeck realized increases ranging 100%-700% in sales volume in $700,000-$1,000,000+ price points. Click on Rhinebeck Town and Village Market Momentum Report to see full detail or view full county market momentum reports by town by clicking here.
|
|
Private Compound
Sylvan Lake Road
Hopewell Junction
69 Acres
$425,000
Located just two miles off the Taconic Parkway/Beekman Road exit on Sylvan Lake Road in Hopewell Junction. Town of Beekman. Arlington schools.
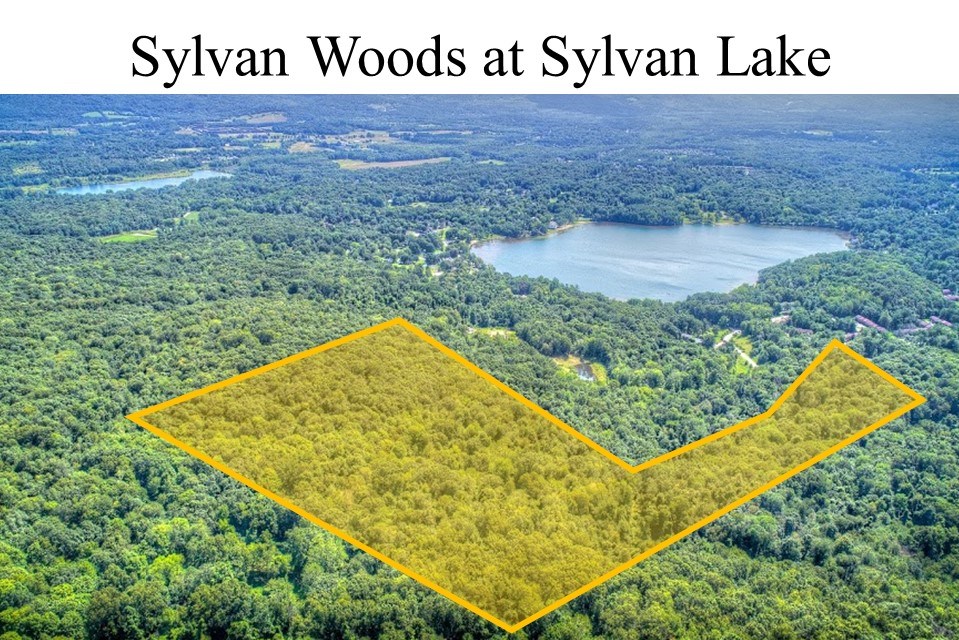
This 69 acre flag lot parcel is pictured below. The parcel had prior 20 lot preliminary subdivision approval with extensive engineering available. Frontage on Sylvan Lake Road. The Town of Beekman has a floating PUD for potential density in an area ripe for transformation or build a private compound. See the full listing by clicking on image below.
|
|
Will the tailwinds keep blowing?
I do believe we will continue to see steady flow into the Hudson Valley for the foreseeable future. The numbers, sadly, are back on an incline with Covid which should continue to translate to increased relocations to the area. There are factors lingering in the sidelines that include taxes, unemployment and homes in forbearance that could turn into foreclosures. Down the road, sectors of the market experiencing inventory squeeze may find more inventory, which could start the shift to a neutral or buyers’ market. All I can say is I know what is now. Now it is a sellers’ market. However, we exist in a world with much uncertainty.
If you want to engage my services in a real estate transaction, or you know someone who is looking for a real estate partner, I will get the job done. No one knows for certain what’s ahead, but I hope that whatever it is, you and your families stay healthy and enjoy special moments. Happy Thanksgiving to all.
Best always,
Sandi
|
Last, but certainly not least, editorial gratitude once again to my dear friend Molly. ;) |
|
|
|
Sandi Park
Associate Real Estate Broker
New Home & Construction Specialist
Berkshire Hathaway Home Services
Hudson Valley Properties
M: 914-522-6282
|
|
Serving the Dutchess County market with offices in LaGrangeville and Rhinebeck, New York |
|
|
|
|
|
|