| |
Stay Informed
Follow us on Social Media for more frequent updates
| |
The Markets (as of market close October 10, 2025)
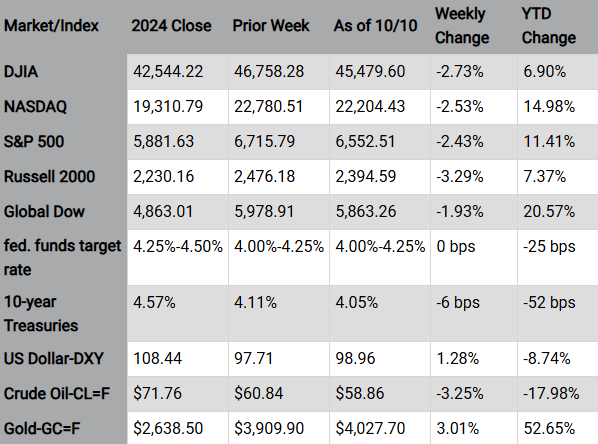
Wall Street was marked by volatility throughout last week. Major indexes, particularly the S&P 500 and the NASDAQ, reached new record highs earlier in the week, driven by an advance in AI stocks and favorable corporate earnings reports. However, the market endured a significant selloff last Friday, reversing much of the week's earlier gains. Investor sentiment turned negative following a threat by President Trump to impose a "massive increase in tariffs" on Chinese imports, reigniting fears of a trade war. As a result, the S&P 500 declined following a seven-day winning streak. The Dow also declined, while the NASDAQ saw the sharpest losses, with tech shares among the biggest decliners. The government shutdown continued into its second week, increasing uncertainty and delaying the release of key economic data. Ten-year Treasury yields fell below 4.10%, while gold prices climbed above $4,000.00 per ounce, a jump that could be a sign of investor anxiety over deficits and potential inflation.
| |
Chart reflects price changes, not total return. Because it does not include dividends or splits, it should not be used to benchmark performance of specific investments. | | |
10/15: Consumer Price Index
10/16: Producer Price Index, retail sales
10/17: Housing starts, import and export prices, industrial production
| | | | |  |
Meet with a Independent Financial Advisor, with over 20 years of Experience | | | Last Week's Economic News | |
- The release of most economic data has been delayed due to the government shutdown.
- The national average retail price for regular gasoline was $3.124 per gallon on October 6, $0.006 per gallon above the prior week's price but $0.012 per gallon less than a year ago. Also, as of October 6, the East Coast price ticked up $0.001 to $2.984 per gallon; the Midwest price rose $0.005 to $2.933 per gallon; the Gulf Coast price increased $0.047 to $2.719 per gallon; the Rocky Mountain price decreased $0.044 to $3.066 per gallon; and the West Coast price dipped $0.012 to $4.226 per gallon.
| | Inflation data for September is ordinarily out this week with the release of the Consumer Price Index. However, the government shutdown has delayed the release of this information. | |
Data sources: Economic: Based on data from U.S. Bureau of Labor Statistics (unemployment, inflation); U.S. Department of Commerce (GDP, corporate profits, retail sales, housing); S&P/Case-Shiller 20-City Composite Index (home prices); Institute for Supply Management (manufacturing/services). Performance: Based on data reported in WSJ Market Data Center (indexes); U.S. Treasury (Treasury yields); U.S. Energy Information Administration/Bloomberg.com Market Data (oil spot price, WTI, Cushing, OK); www.goldprice.org (spot gold/silver); Oanda/FX Street (currency exchange rates). News items are based on reports from multiple commonly available international news sources (i.e. wire services) and are independently verified when necessary with secondary sources such as government agencies, corporate press releases, or trade organizations. All information is based on sources deemed reliable, but no warranty or guarantee is made as to its accuracy or completeness. Neither the information nor any opinion expressed herein constitutes a solicitation for the purchase or sale of any securities, and should not be relied on as financial advice. Past performance is no guarantee of future results. All investing involves risk, including the potential loss of principal, and there can be no guarantee that any investing strategy will be successful.
The Dow Jones Industrial Average (DJIA) is a price-weighted index composed of 30 widely traded blue-chip U.S. common stocks. The S&P 500 is a market-cap weighted index composed of the common stocks of 500 leading companies in leading industries of the U.S. economy. The NASDAQ Composite Index is a market-value weighted index of all common stocks listed on the NASDAQ stock exchange. The Russell 2000 is a market-cap weighted index composed of 2,000 U.S. small-cap common stocks. The Global Dow is an equally weighted index of 150 widely traded blue-chip common stocks worldwide. The U.S. Dollar Index is a geometrically weighted index of the value of the U.S. dollar relative to six foreign currencies. Market indices listed are unmanaged and are not available for direct investment.
| |
You have Questions, we have Answers | | | | |
David S. Nilsen
President & LPL Financial Advisor
| |
805 Aerovista Pl. Ste 206
San Luis Obispo, CA 93401
(805)541-6500
(866)-786-0811
| | |
David Nilsen, CA Insurance Lic #0B50436 is a registered representative and investment advisor representative with and offers securities and advisory services through LPL Financial , member FINRA/SIPC, a registered investment advisor. "This email is an advertisement and you may opt out of receiving further e-mails. To opt out, please respond to this email with "Opt Out" in the subject field"
Fixed insurance products and services offered by Obispo Wealth Management are separate and unrelated to LPL.
This communication is strictly intended for individuals residing in the state(s) of AZ, CA, DC, ID, MI, MO, MT, NM, NV, OR, TN, TX, WA. No offers may be made or accepted from any resident outside the specific states referenced. Prepared by Broadridge Investor Communication Solutions, Inc. Copyright 2025.
|
Data sources: News items are based on reports from multiple commonly available international news sources (i.e. wire services) and are independently verified when necessary with secondary sources such as government agencies, corporate press releases, or trade organizations. Market data: Based on data reported in WSJ Market Data Center (indexes); U.S. Treasury (Treasury yields); U.S. Energy Information Administration/Bloomberg.com Market Data (oil spot price, WTI Cushing, OK); www.goldprice.org (spot gold/silver); Oanda/FX Street (currency exchange rates). All information is based on sources deemed reliable, but no warranty or guarantee is made as to its accuracy or completeness. Neither the information nor any opinion expressed herein constitutes a solicitation for the purchase or sale of any securities, and should not be relied on as financial advice. Past performance is no guarantee of future results. All investing involves risk, including the potential loss of principal, and there can be no guarantee that any investing strategy will be successful.
The Dow Jones Industrial Average (DJIA) is a price-weighted index composed of 30 widely traded blue-chip U.S. common stocks. The S&P 500 is a market-cap weighted index composed of the common stocks of 500 leading companies in leading industries of the U.S. economy. The NASDAQ Composite Index is a market-value weighted index of all common stocks listed on the NASDAQ stock exchange. The Russell 2000 is a market-cap weighted index composed of 2,000 U.S. small-cap common stocks. The Global Dow is an equally weighted index of 150 widely traded blue-chip common stocks worldwide. Market indices listed are unmanaged and are not available for direct investment.
| | | | |