October 1, 2026 | BWE Arizona | Putting clients first. Trusted to be part of their future. | | | Agency
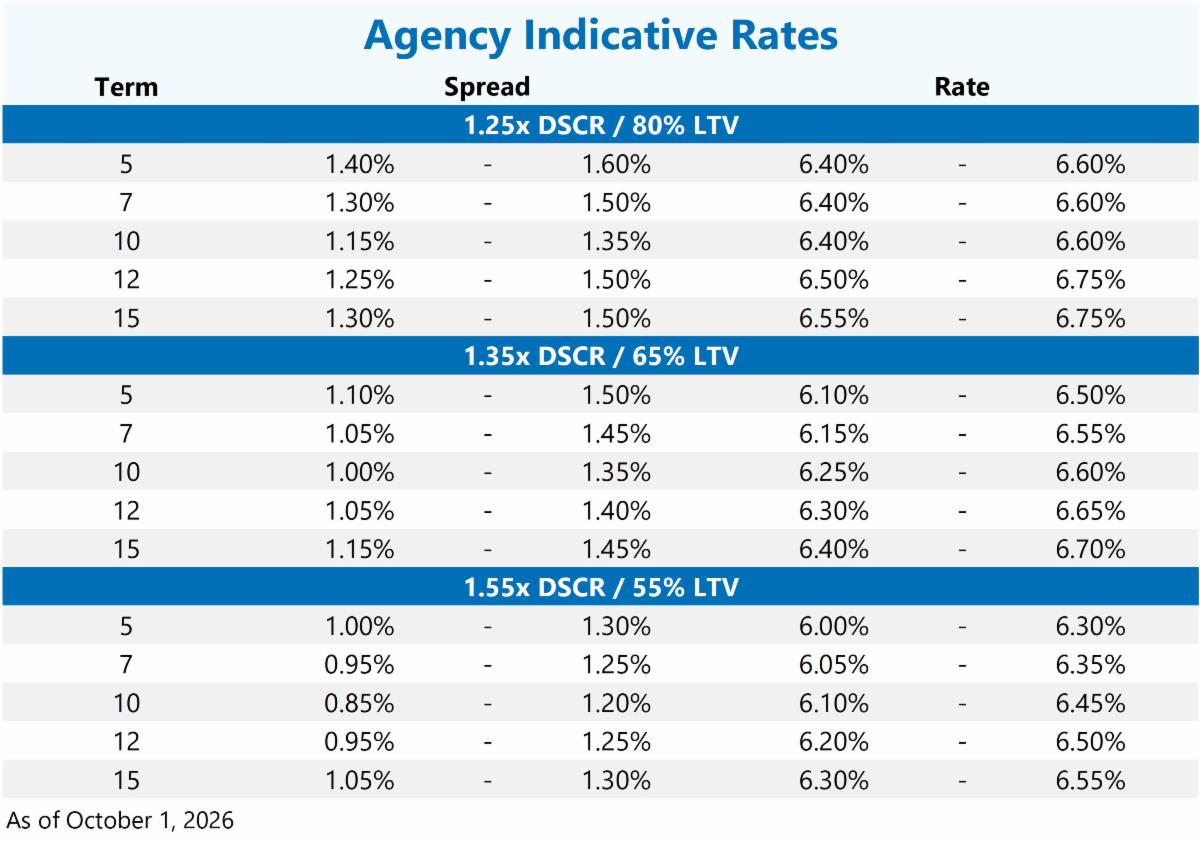
6.45%
0.80% + 10yr UST
Low leverage multifamily refinance | Life Company
6.45%
1.20% + 10yr UST
Low leverage multifamily refinance | | | |
Key takeaways
- No deal: The 10- and 30-year Treasury yields reached their highest levels since 2007 and 2004, respectively, after President Trump rejected Iran’s latest proposal to reopen the Strait of Hormuz, pushing Brent crude back to approximately $108 a barrel this morning.
- Volatility wakes up: The ICE BofA MOVE Index posted its largest weekly increase since April 2025 last week, as hawkish Federal Reserve commentary and swinging energy prices weighed on U.S. Treasuries.
- A crowded runway to October: After a data-light stretch, the U.S. economic calendar reloads with August core PCE and the September employment report, bracketed by a wall of Fed speakers — the first real test of the hawkish narrative since this month's Fed rate hike.
The 10-year Treasury yield touched a weekly high of 5.23% last week, its highest level since 2007, before closing at 5.16%; however, it has pushed to a fresh high of 5.27% earlier this week, up roughly 11 basis points on the session, extending beyond last week's peak as the energy-driven repricing resumes. The 30-year bond yield closed last week at 5.49% and was at 5.58%, a fresh high since 2004. The 2-to-10-year Treasury curve steepened from about 20 basis points early last week to 31 basis points at Friday’s close and widened further to approximately 32 basis points early this week. Last week's slate of Treasury auctions, $69 billion of 2-year notes, $70 billion of 5-year notes, and $44 billion of 7-year notes, all drew softer demand.
NY Fed President Williams' keynote address and Fed Vice Chair Jefferson's monetary policy remarks this week are among the appearances that could skew Treasuries given the live debate over an October rate hike move. At the time of writing, swap market projections show a 68% chance of a hike at the October 28 meeting, with solid odds of a second hike by the December 9 meeting as well. Further out, markets are pricing roughly 2 additional quarter-point hikes by the end of 2027, though odds that far out remain considerably more fluid.
Treasury yields continue to trade higher primarily off developments in global energy markets, with the relationship between oil and rates once again in focus this morning. President Trump's rejection of Iran's latest Strait of Hormuz proposal over the weekend, which had offered a seven-day reopening in exchange for an end to the naval blockade, sanctions relief, and a broader ceasefire, renewed supply concerns. The stalemate pushed Brent crude oil back to approximately $108 per barrel.
Both sides have left the door open to diplomacy, with indirect talks expected to continue this week. Still, the near-term impasse has intensified energy-driven inflation concerns and kept the market tone hawkish. Notably, Treasury yields reached multi-decade highs last week despite a light economic calendar, driven more by hawkish Fed commentary and inflation concerns tied to energy prices than by economic data.
This week is a different story with August's Personal Consumption Expenditures (PCE) inflation report and September's Nonfarm Payrolls report standing out as the two key economic events markets will trade off. Ancillary economic growth data, including Core Capital Goods Orders in the August Durable Goods report, beat expectations by a wide margin, pointing to a resilient growth backdrop that could keep pressure on both the Fed and Treasury yields. That combination, resilient growth data feeding through to firmer price pressure, is the underlying dynamic keeping the Fed's tightening bias intact.
| | |
Quick hits
Agency volumes through August
- Fannie Mae posted $5.1 billion in loans delivered (July closings) for $41.7 billion YTD, and slightly ahead (3%) of last year’s $40.5 billion YoY
- Freddie Mac posted $5.9 billion in loans delivered (July closings) for $41.5 billion YTD, and 9% ahead of last year’s $38.1 billion YoY
Freddie Adjustable-Rate Mortgage (ARM)
- Min $10MM, standard 1 yr lockout followed by 1% prepayment penalty that is waived if refinanced into new fixed rate loan
- 35 yr amortization available for eligible sponsors
- Buydowns are available for floating rate spreads up to 1% or 30 bps
- Floating pricing is 190-200 bps before the buydown/165-175 bps with a buydown
Fannie Structured Adjustable-Rate Mortgage (SARM)
- Min loan size $25MM, 35 yr amort available for eligible sponsors
- Standard 1 yr lock out followed by 1% prepayment
- Buydowns are available for floating rate spreads up to 1%
- Requires an initial 3 yr third party cap, followed by a 2 yr replacement cap escrowed at 110% of the strike rate, escrows are adjusted every 6 months
- Floating pricing is 215-225 bps before the buydown/190-200 bps with a buydown
The tone in Agency CMBS turned cautious last week. As Treasury yields surged and rate volatility jumped, traders said buyers grew more selective. Traders also noted that bond investor selling pressure was well above average. New issue Fannie Mae DUS/MBS investor spreads have widened 3-5 bps over the past week across the standard 5/4.5, 7/6.5, and 10/9.5 structures.
After holding steady through much of the year, spreads leaked wider as asset managers and other long-term bond investors rotated out of Agency and Non-Agency CMBS and into residential MBS, where they saw better relative value. Fannie Mae DUS/MBS rate lock volume reached roughly $1.5 billion, more than double the roughly $740 million 4-week moving average and the highest weekly total since late June.
The week featured four fixed-rate portfolio blocks over $100 million and five SARM prints across 5-year and 7-year structures. Friday was especially heavy as borrowers rushed to lock and close loans ahead of month- and quarter-end. Rate buydowns accounted for more than 60% of third-quarter volume, up from a roughly even split year-to-date.
Many borrowers are using buydowns to gain additional net proceeds. Freddie Mac priced its roughly $990 million K-768 seven-year fixed-rate K-deal, which widened from initial dealer guidance amid the volatility. Freddie also brought about $475 million of fixed- and floating-rate Multifamily Participation Certificates.
Generic Ginnie Mae project loan and construction loan spreads both widened to year-to-date highs at the time of this writing. The Fed is also reportedly exploring higher asset thresholds for stricter bank oversight. That would give regional banks more room to lend, and the added competition could support tighter agency spreads.
On corporate credit, the Markit CDX Investment Grade 5-year Index widened by about 2 bps, while the Bloomberg Single-A Industrials 10-year Index spread tightened 2 bps. Investment-grade corporate issuance reached roughly $35 billion, short of the $40 billion estimate, as surging Treasury yields stalled late-week loans. Residential MBS and investment-grade corporate spreads also widened. Broker-dealer balance sheets grew back toward record highs.
Loan highlights
Fannie Mae refinance in Philadelphia, PA
- $41.6 million
- 65% LTV / 1.25x DSCR
- 130 bps spread
- 7-yr term / 2 yrs IO / 35 yr amort
Fannie Mae refinance in Louisville, KY
- $10.1 million
- 65% LTV / 1.35x DSCR
- 128 bps spread
- 10-yr term / 5 yrs IO / 30 yr amort
| | |
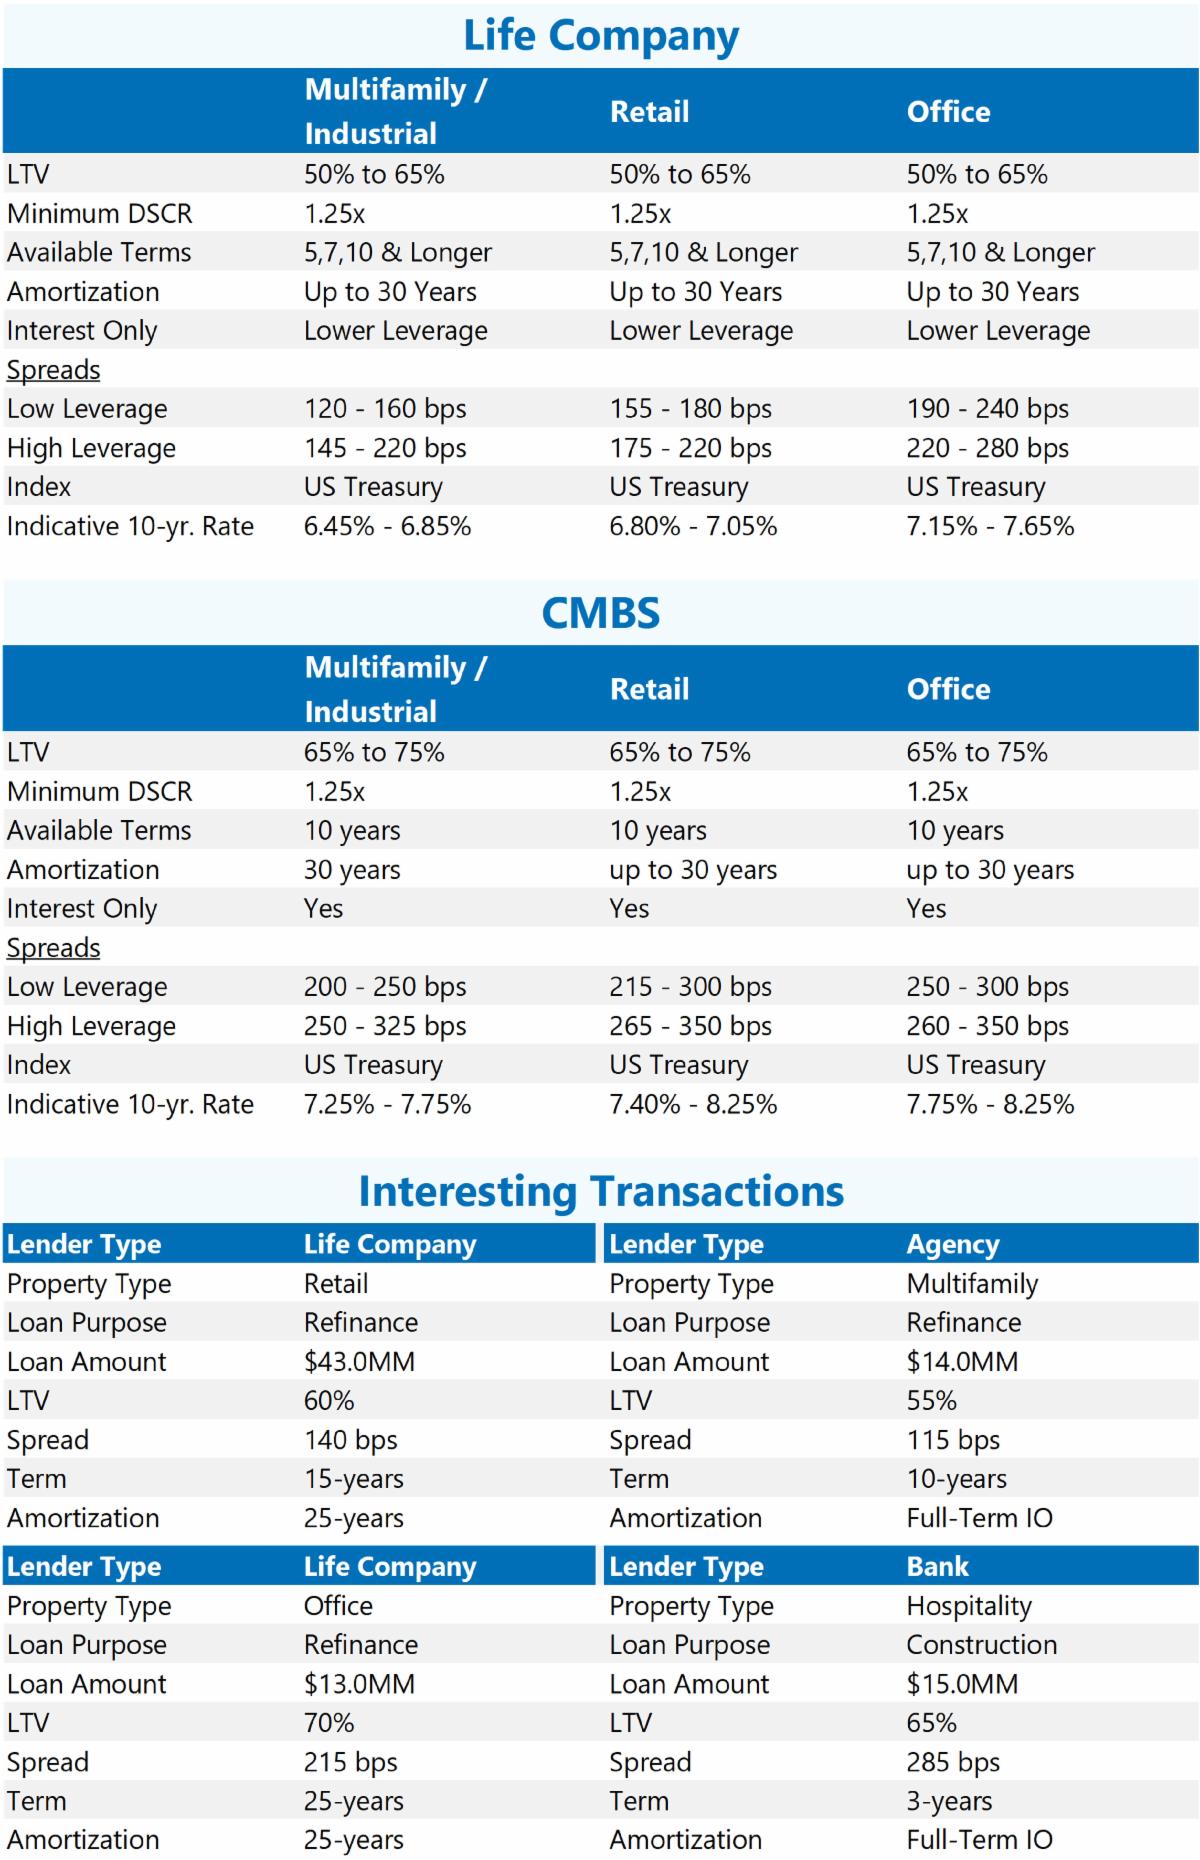
Life Company lenders reported that loan volume has slowed over the past month while U.S. Treasury indices continue their march upward. As such, there has been a general unwillingness by borrowers to seek long-term, fixed rate capital for their acquisitions and refinancing. For upcoming loan maturities, many borrowers have inquired about capital refinancing possibilities with two- to five-year loan terms.
Most lenders offer short-term, core floating rate loans, or in the alternative, can provide fixed rate structures with flexible step-down prepayment options. Floating rate financing options are generally priced over SOFR while fixed-rate loans would be priced over the appropriate UST index.
Spread indications for core floating rate loans are 180-225 bps and usually require minimum interest but can be repaid at par during the term. Fixed rate spreads generally range between of 130-180 bps for well-located, good-quality assets with pricing adders for prepayment flexibility during the loan term. Lenders have quoted spreads as low as 110 bps to win high-quality and low-leveraged properties.
| | |
U.S. CMBS issuance has remained steady and now totals approximately $99 billion YTD, ahead of $91.4 billion YoY. Conduit spreads have found stability in recent weeks despite volatility in the Treasury markets with 10‑year AAA spreads currently at 71 bps over Treasuries—tighter than the trailing 12‑month average of approximately 75 bps.
Borrower spreads have remained range‑bound over the past several months. Ten‑year CMBS loans are generally pricing at 200-225 bps over Treasuries, while five‑year CMBS loans are pricing in the low‑to‑mid 200 bps range. For high‑quality, low‑leverage transactions, pricing can be as low as 150 bps over Treasuries.
Multifamily assets continue to attract strong lender demand with CMBS lenders maintaining a willingness to offer full‑term, interest‑only structures. These loans allow borrowers to maximize proceeds with underwriting typically supporting a 1.25x DSCR on an interest‑only basis. In addition, several CMBS lenders have secured dedicated B‑buyers for multifamily‑only securitizations, enabling the introduction of “stretch senior” executions. These loans are generally priced at 180-225 bps over Treasuries and can be sized down to a 1.20x DSCR on an interest‑only basis.
Other property types including office have also benefited from the availability of full‑term, interest‑only financing. However, these transactions are subject to more conservative leverage constraints, higher debt yield requirements, and tighter overall underwriting standards compared to multifamily loans.
| | |
About BWE
Bellwether Enterprise (BWE) is one of the nation's largest privately-owned real estate financing companies. Its trusted advisors combine innovation, extensive experience and strong lender relationships to optimize a loan's capital stack for commercial and multifamily investors, developers and property owners. For more information, visit BWE.com.
| | |
Opinions, estimates, forecasts and all other information contained in this document are those of BWE and should not be construed as indicating BWE’s business prospects or expected results. Although BWE attempts to provide reliable, useful information, it does not guarantee that the information or other content in this document is accurate, current, or suitable for any particular purpose. All content is provided on an “as is” basis, with no warranties of any kind whatsoever and is subject to change at any time without notice. Information in this document may not be used without permission from BWE. This document is not intended to be an offer to buy or sell or a solicitation of an offer to buy or sell securities, if any, referred to herein.
Bellwether Enterprise Real Estate Capital, LLC (BWE) conducts business through Bellwether Enterprise Mortgage Investments, LLC – Mortgage Banker license #BK-1007784 – the Department of Financial Institutions State of AZ (Fannie Mae transactions), as well as Bellwether Enterprise Real Estate Capital, LLC – Mortgage Banker License #BK-1007825 – the Department of Financial Institutions State of AZ (all other transactions).
| | | | |