Dear Florida Climate Center Friends, | |
In this Fall 2026 edition of our newsletter, we present the monthly climate summaries for the past three months, June-August, as well as recent rainfall patterns and drought conditions around the state. We discuss the latest on El Niño and what it may mean for Florida this winter and how the Atlantic hurricane season so far compares to past years. We also share some of the recent events and engagements we've been involved in. We hope you enjoy reading this newsletter and, as always, if you have any questions feel free to reach out to us at climate@coaps.fsu.edu.
Thanks,
The Staff of the Florida Climate Center
| |
| Monthly climate summaries for Florida | |
The Florida Climate Center's monthly Climate Summaries for summer are available. These summaries provide an analysis of temperature and precipitation patterns across the state, along with data on hazardous weather, drought, and daily records tied or broken each month.
June monthly average temperatures were near to above normal. Average monthly temperature departures from normal ranged from -0.5 ̊F in Pensacola to +3.1 ̊F in Sarasota. Several locations recorded their warmest June on record, including Clermont (based on 73 years), Sarasota/Bradenton (113 years), and Lakeland which tied for record warmest with 2010 (64 years). Most other locations in South Florida recorded one of their top 5 warmest months of June on record.
July monthly average temperatures were above normal. Average monthly temperature departures from normal ranged from +0.7 ̊F in Tampa to +2.6 ̊F in Orlando and West Palm Beach. The month brought high humid heat and Ocala, Fort Lauderdale, and Lakeland recorded their warmest July on record while most stations around the state registered one of their top 10 warmest Julys on record.
August monthly average temperatures were near to above normal. Average monthly temperature departures from normal ranged from -1.4 ̊F in Hastings to +2.6 ̊F in Fort Lauderdale. High heat continued in August and stations across South Florida registered one of their top 5 warmest Augusts on record.
The figures below are graphical depictions of the monthly rainfall departure from normal (in inches) for June (top), July (middle), and August (bottom) (courtesy of the National Weather Service). Also included is the rainfall departure from normal map for summer, June-August.
*Click each map below to view a larger image.
| | Summer 2026 (June-August) | | Summer 2026 was record warm in South Florida | | |
According to data from the National Centers for Environmental Information, or NCEI, central and south Florida just wrapped up their warmest summer on record (June-August). Statewide, Florida experienced its 3rd-warmest summer on record based on average temperatures.
Several stations also registered their warmest summer on record, including Ocala (121 years), Orlando (72 years), Lakeland (63 years), Fort Pierce (118 years), West Palm Beach (128 years), Fort Lauderdale (106 years), and Miami tied for first (125 years).
The heat this summer was persistent due to weather patterns that featured strong subtropical high pressure and ridging that increased atmospheric stability and allowed temperatures to climb. In August, parts of Florida saw an unusual intrusion of drier air aloft which allowed Miami to reach 100 ̊F on the 18th for only the 2nd time on record (not since July 21, 1942) and Fort Lauderdale to reach 100 ̊F on the 20th also for the 2nd time on record (not since August 4, 1944). Miami also experienced 56 consecutive days with temperatures reaching 90 ̊F or higher from June 11 to August 5, which tied for its longest streak of 90 ̊F+ days on record (tied with 2023). Other factors that contributed to the high heat included lingering drought conditions and warm sea surface temperatures in the areas surrounding Florida.
| | Summer (June - August) 2026 average temperature county rankings based on the period 1895-2026, from the National Centers for Environmental Information. Select station rankings are also provided. | | Long-term drought conditions linger but improve | | |
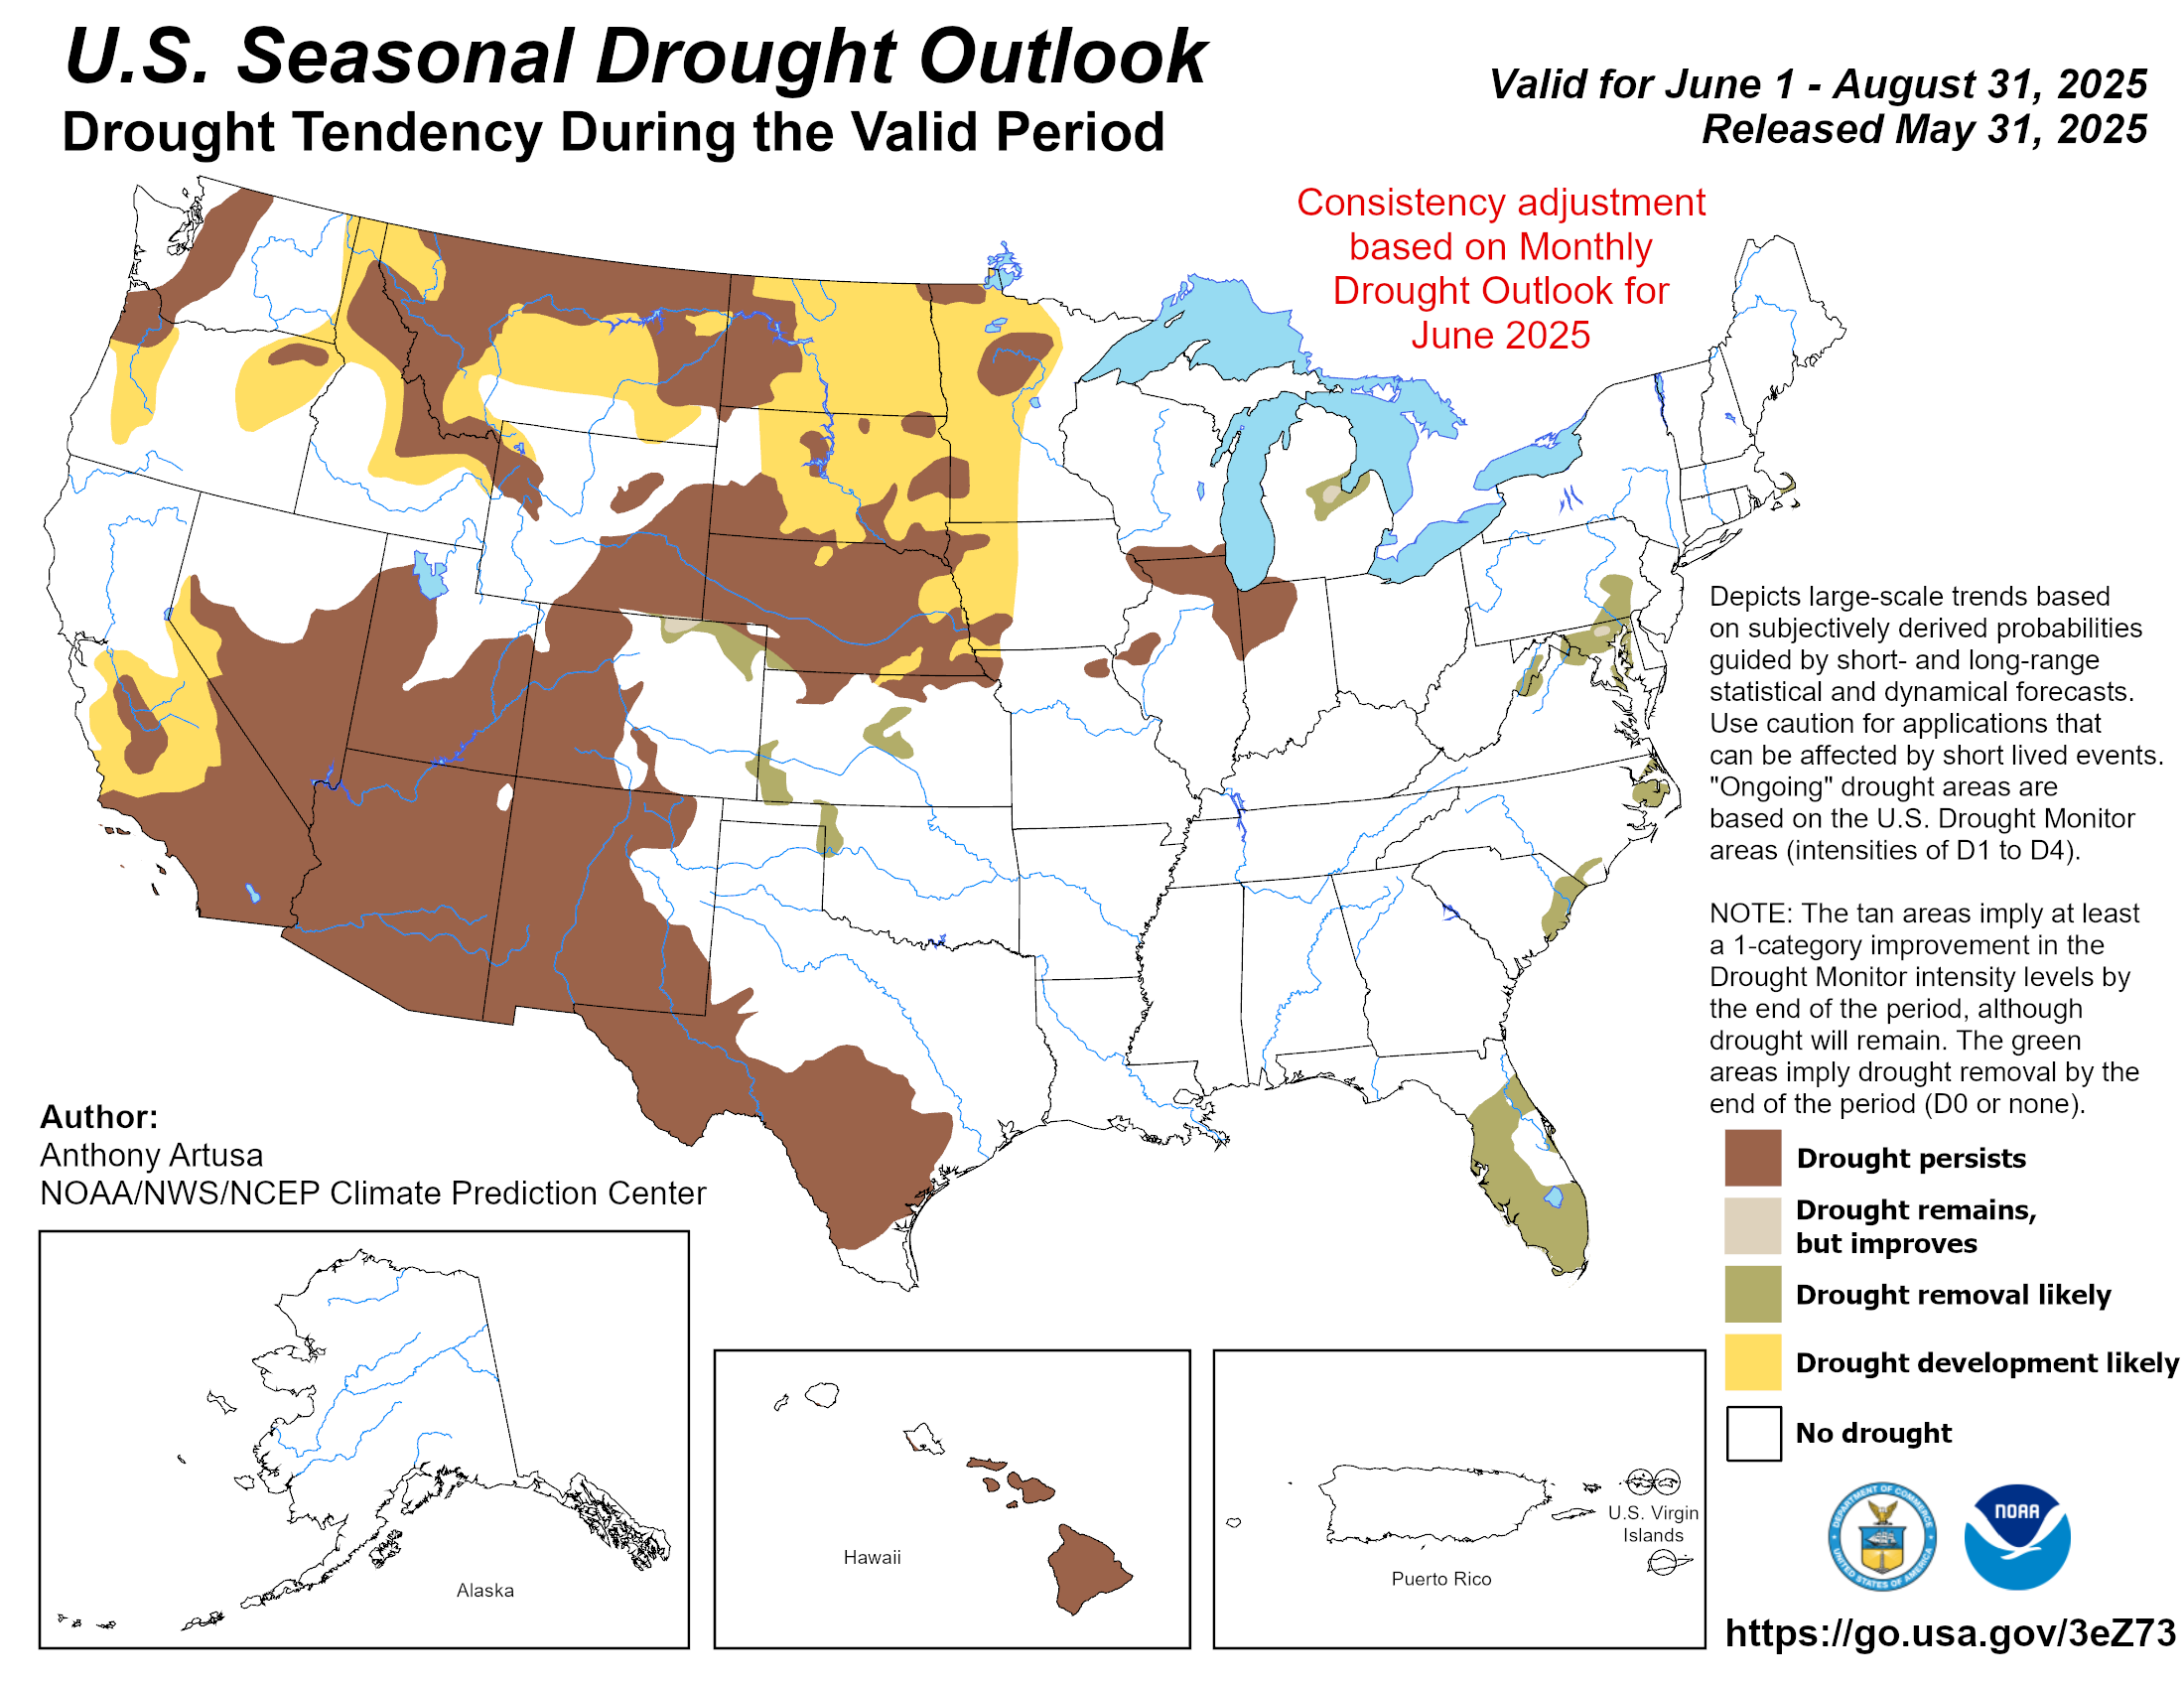
It is bizarre to be discussing drought this far into the wet season but here we are. While the last few months saw drought improve across Florida, typical spotty showers and thunderstorms resulted in variable rainfall totals and long-term drought impacts continued in many areas of the state. June featured between a 1- and 3-category improvement in drought in the Panhandle, northwest Florida, and much of South Florida, while July and August saw more isolated areas of improvement and degradation.
Areas most impacted by long-term drought conditions have included the Santa Fe River basin, the Tampa Bay Area stretching to Highlands County, and South Florida. In the Everglades, wildfires continued to burn through August and water remains low but has started to improve. Lake Okeechobee water levels remain below average for this time of year. As of September 8, about 59% of the state was still in some level of drought (moderate to extreme), according to the U.S. Drought Monitor. Check out our latest and previous weekly drought summaries for more information here.
| | Weekly drought summary for Florida, valid September 8, 2026. This summary highlights the latest U.S. Drought Monitor map, changes from the previous week, and expected conditions for the next week. | | El Niño expected to influence cool season weather patterns in Florida | | |
This El Niño is shaping up to be a unique event, as it is on pace to become record strong. What this means in terms of impacts remains more uncertain but a very strong event does increase the chances that typical impacts will occur. Ocean warming in El Niño monitoring regions has already reached record levels for this time of year, while peak strength is expected to occur later this fall. According to the most recent official forecast from the Climate Prediction Center, a very strong event (defined as sea surface temperature anomalies reaching at least 2.0 ̊C or greater in the Nino-3.4 index region) is virtually certain with chances near 100% during September through November (graphic below). El Niño conditions will persist through the Northern Hemisphere winter 2026-2027, and likely into spring 2027 (82% chance March-May) before dissipating.
Read more here to learn about the current El Niño forecast and potential implications for Florida.
| | ENSO strength probabilities for the Nino-3.4 relative sea surface temperature index (5 ̊N-5 ̊S, 170 ̊W-120 ̊W) minus tropical mean (20 ̊N-20 ̊S). the relative index is re-scaled to match the variance of the traditional index. Source: NOAA Climate Prediction Center. | | The 2026 Atlantic hurricane season vying for lowest on record | |
Unfavorable atmospheric conditions have dominated across much of the basin so far this season. To date, there have been a total of 5 tropical storms and no hurricanes. Three of those 5 storms formed in the northern Gulf and impacted states along the northern Gulf Coast.
Currently, there is an area in the Atlantic forecasters are watching for potential development, but chances for development are low (currently 30%) and at this point it does not appear that it will be a threat to land.
On average by the 2nd week of September - at the season's peak - the basin would have produced 8 named storms, including 3 hurricanes and 1 major hurricane. There have only been 2 years on record with no hurricanes in the Atlantic, but those were 1907 and 1914 well before the satellite era when records are less reliable. Since the modern satellite era, no year has gone without at least 2 Atlantic hurricanes. The accumulated cyclone energy (ACE), which measures the cumulative total storm intensity and duration for the season, is at a record low level - another indicator of just how quiet the season has been.
What does all this mean for Florida? There is still a lot of season to go and sea surface temperatures in the basin have been above average to record warm in recent months. If more favorable atmospheric conditions form, the warm sea surface temperatures would help support storm development and intensification. The best chances for development moving forward may continue to be in areas closer to land, where risk of landfall and direct impacts are greatly increased. Last year, we enjoyed a welcome reprieve from storms here in the sunshine state. While TS Bertha brought indirect impacts to the Panhandle coast, back-to-back hurricane seasons without any direct impacts in Florida are rare, happening only a few times since 1851. Fingers crossed that 2026 is another year without direct impacts, but I wouldn't close the books on the season just yet.
| | Storm tracks for all the tropical (and subtropical) cyclones that have occurred within the Atlantic basin in 2026, to date, from the Nationa l Hurricane Center. | | Fall outlook leaning warmer than normal with above-normal precipitation in North Florida, equal chances in South Florida | |
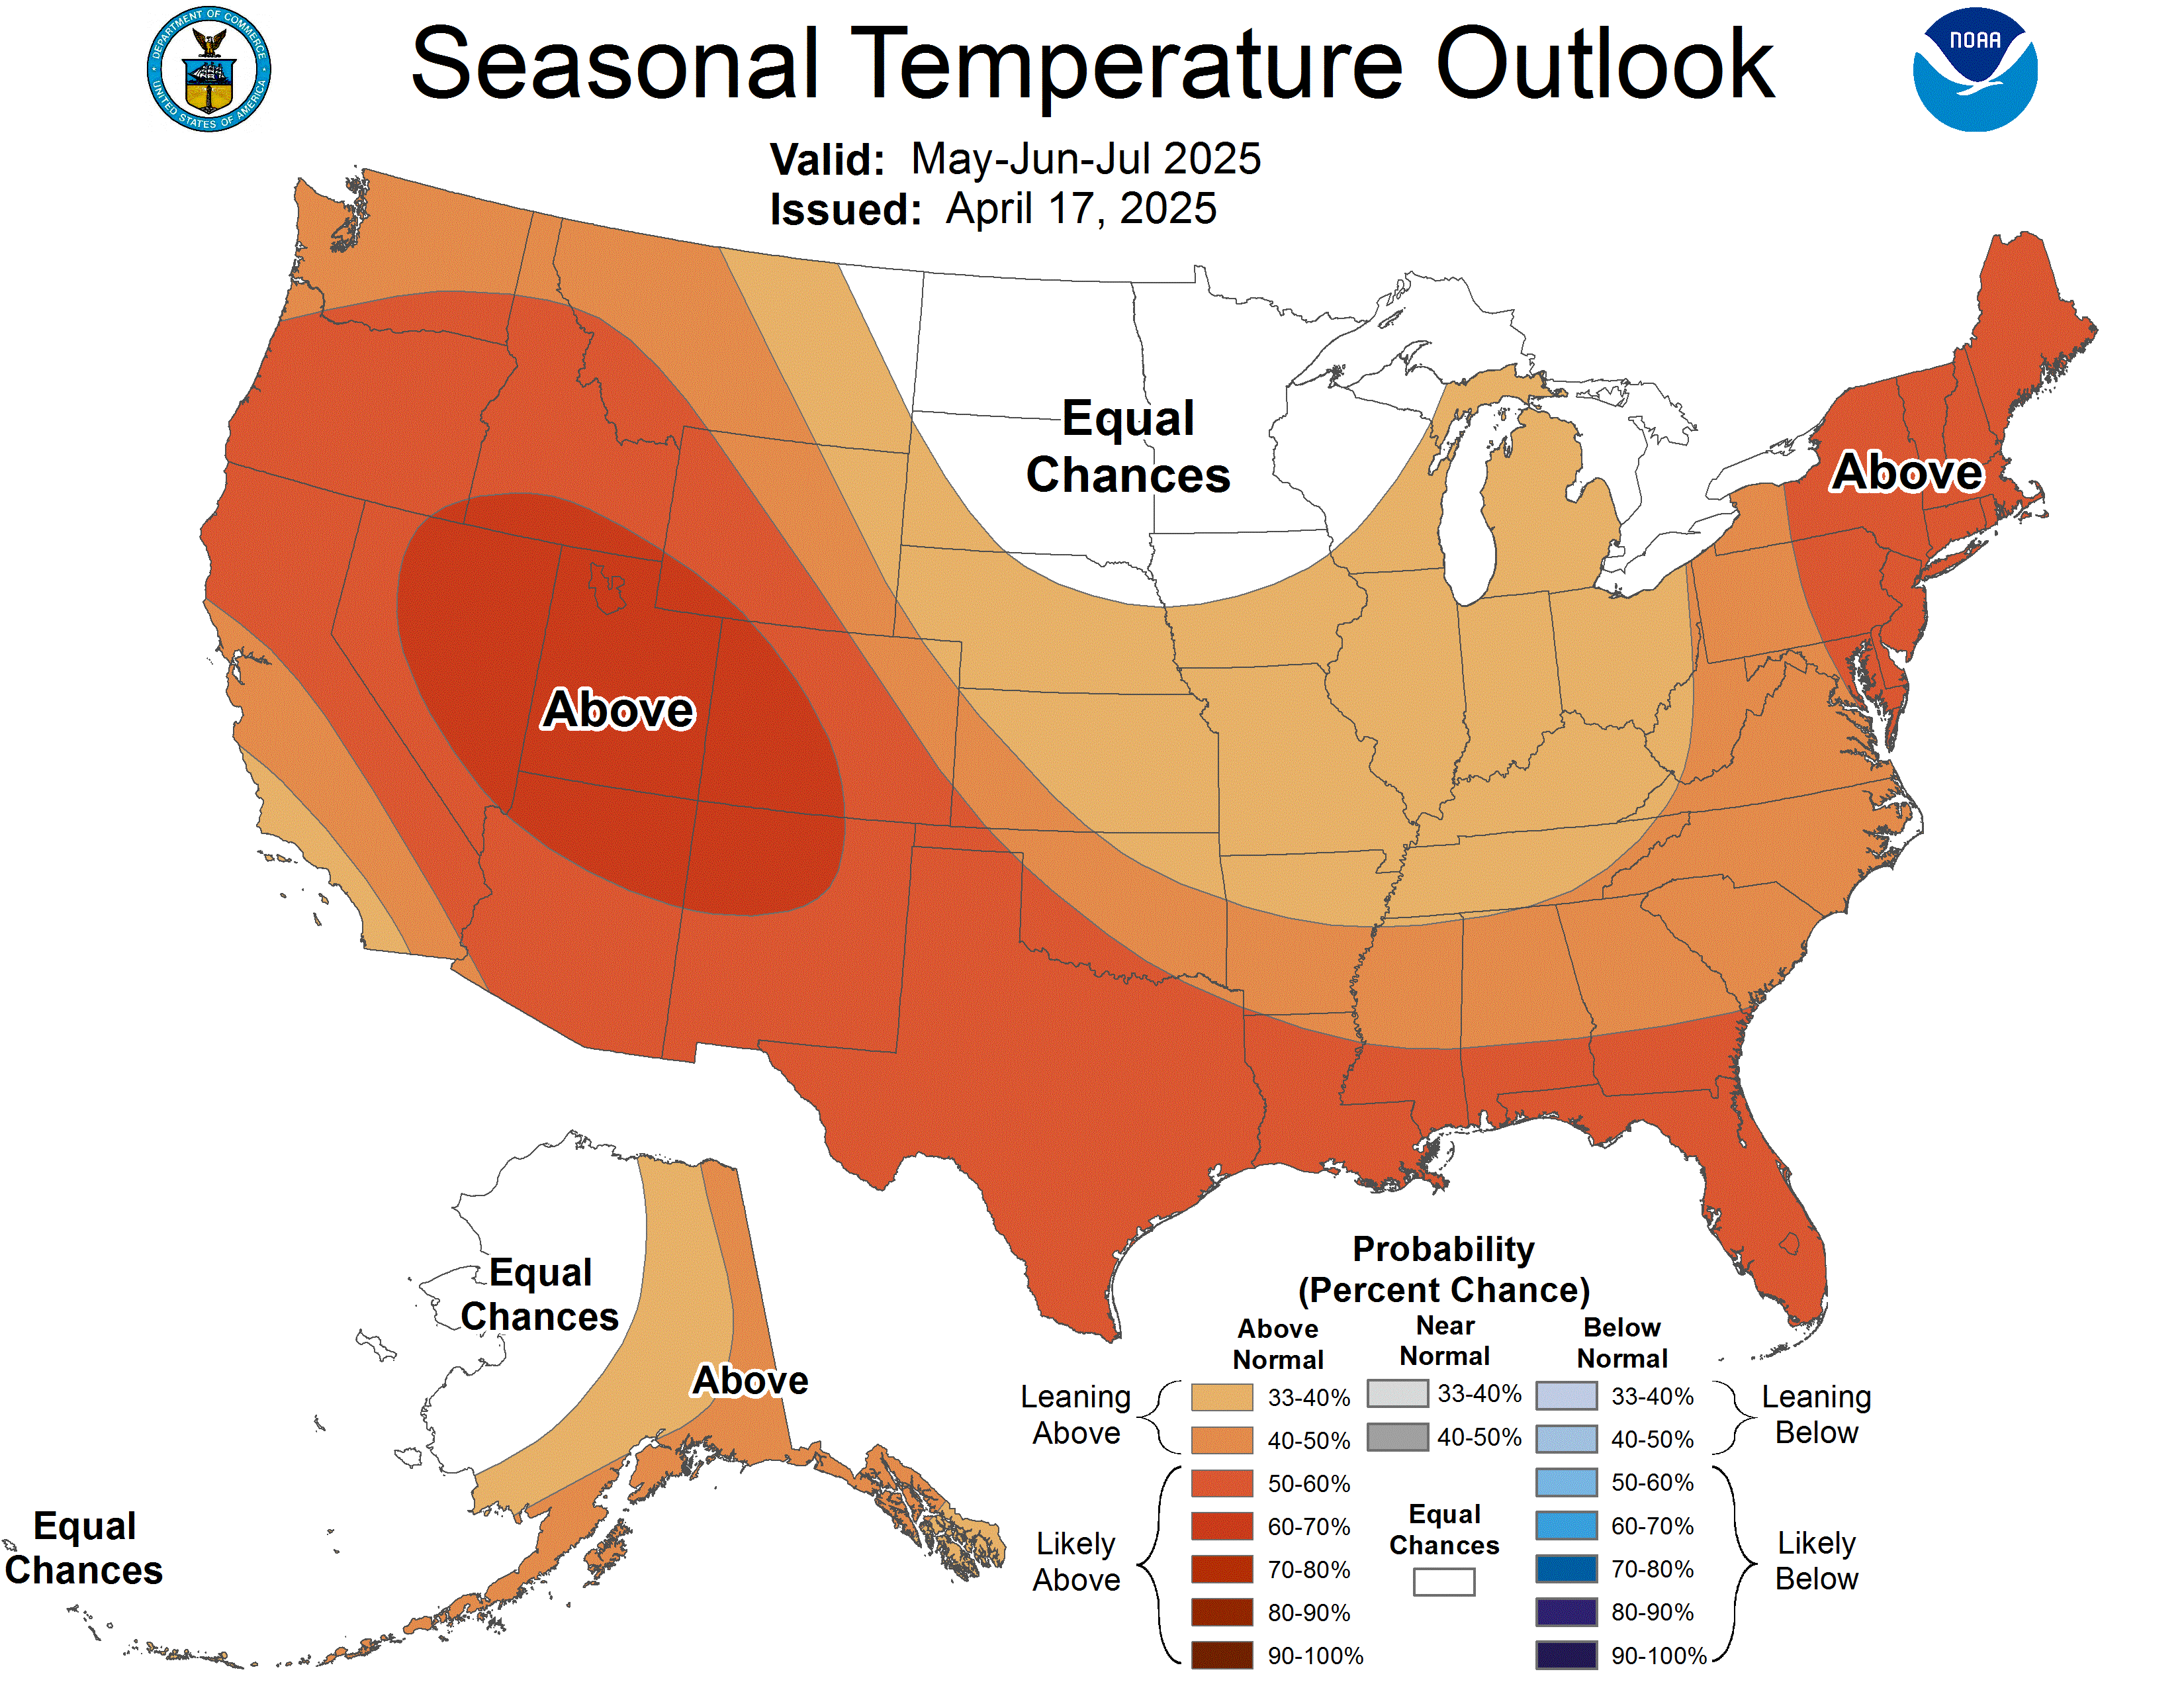
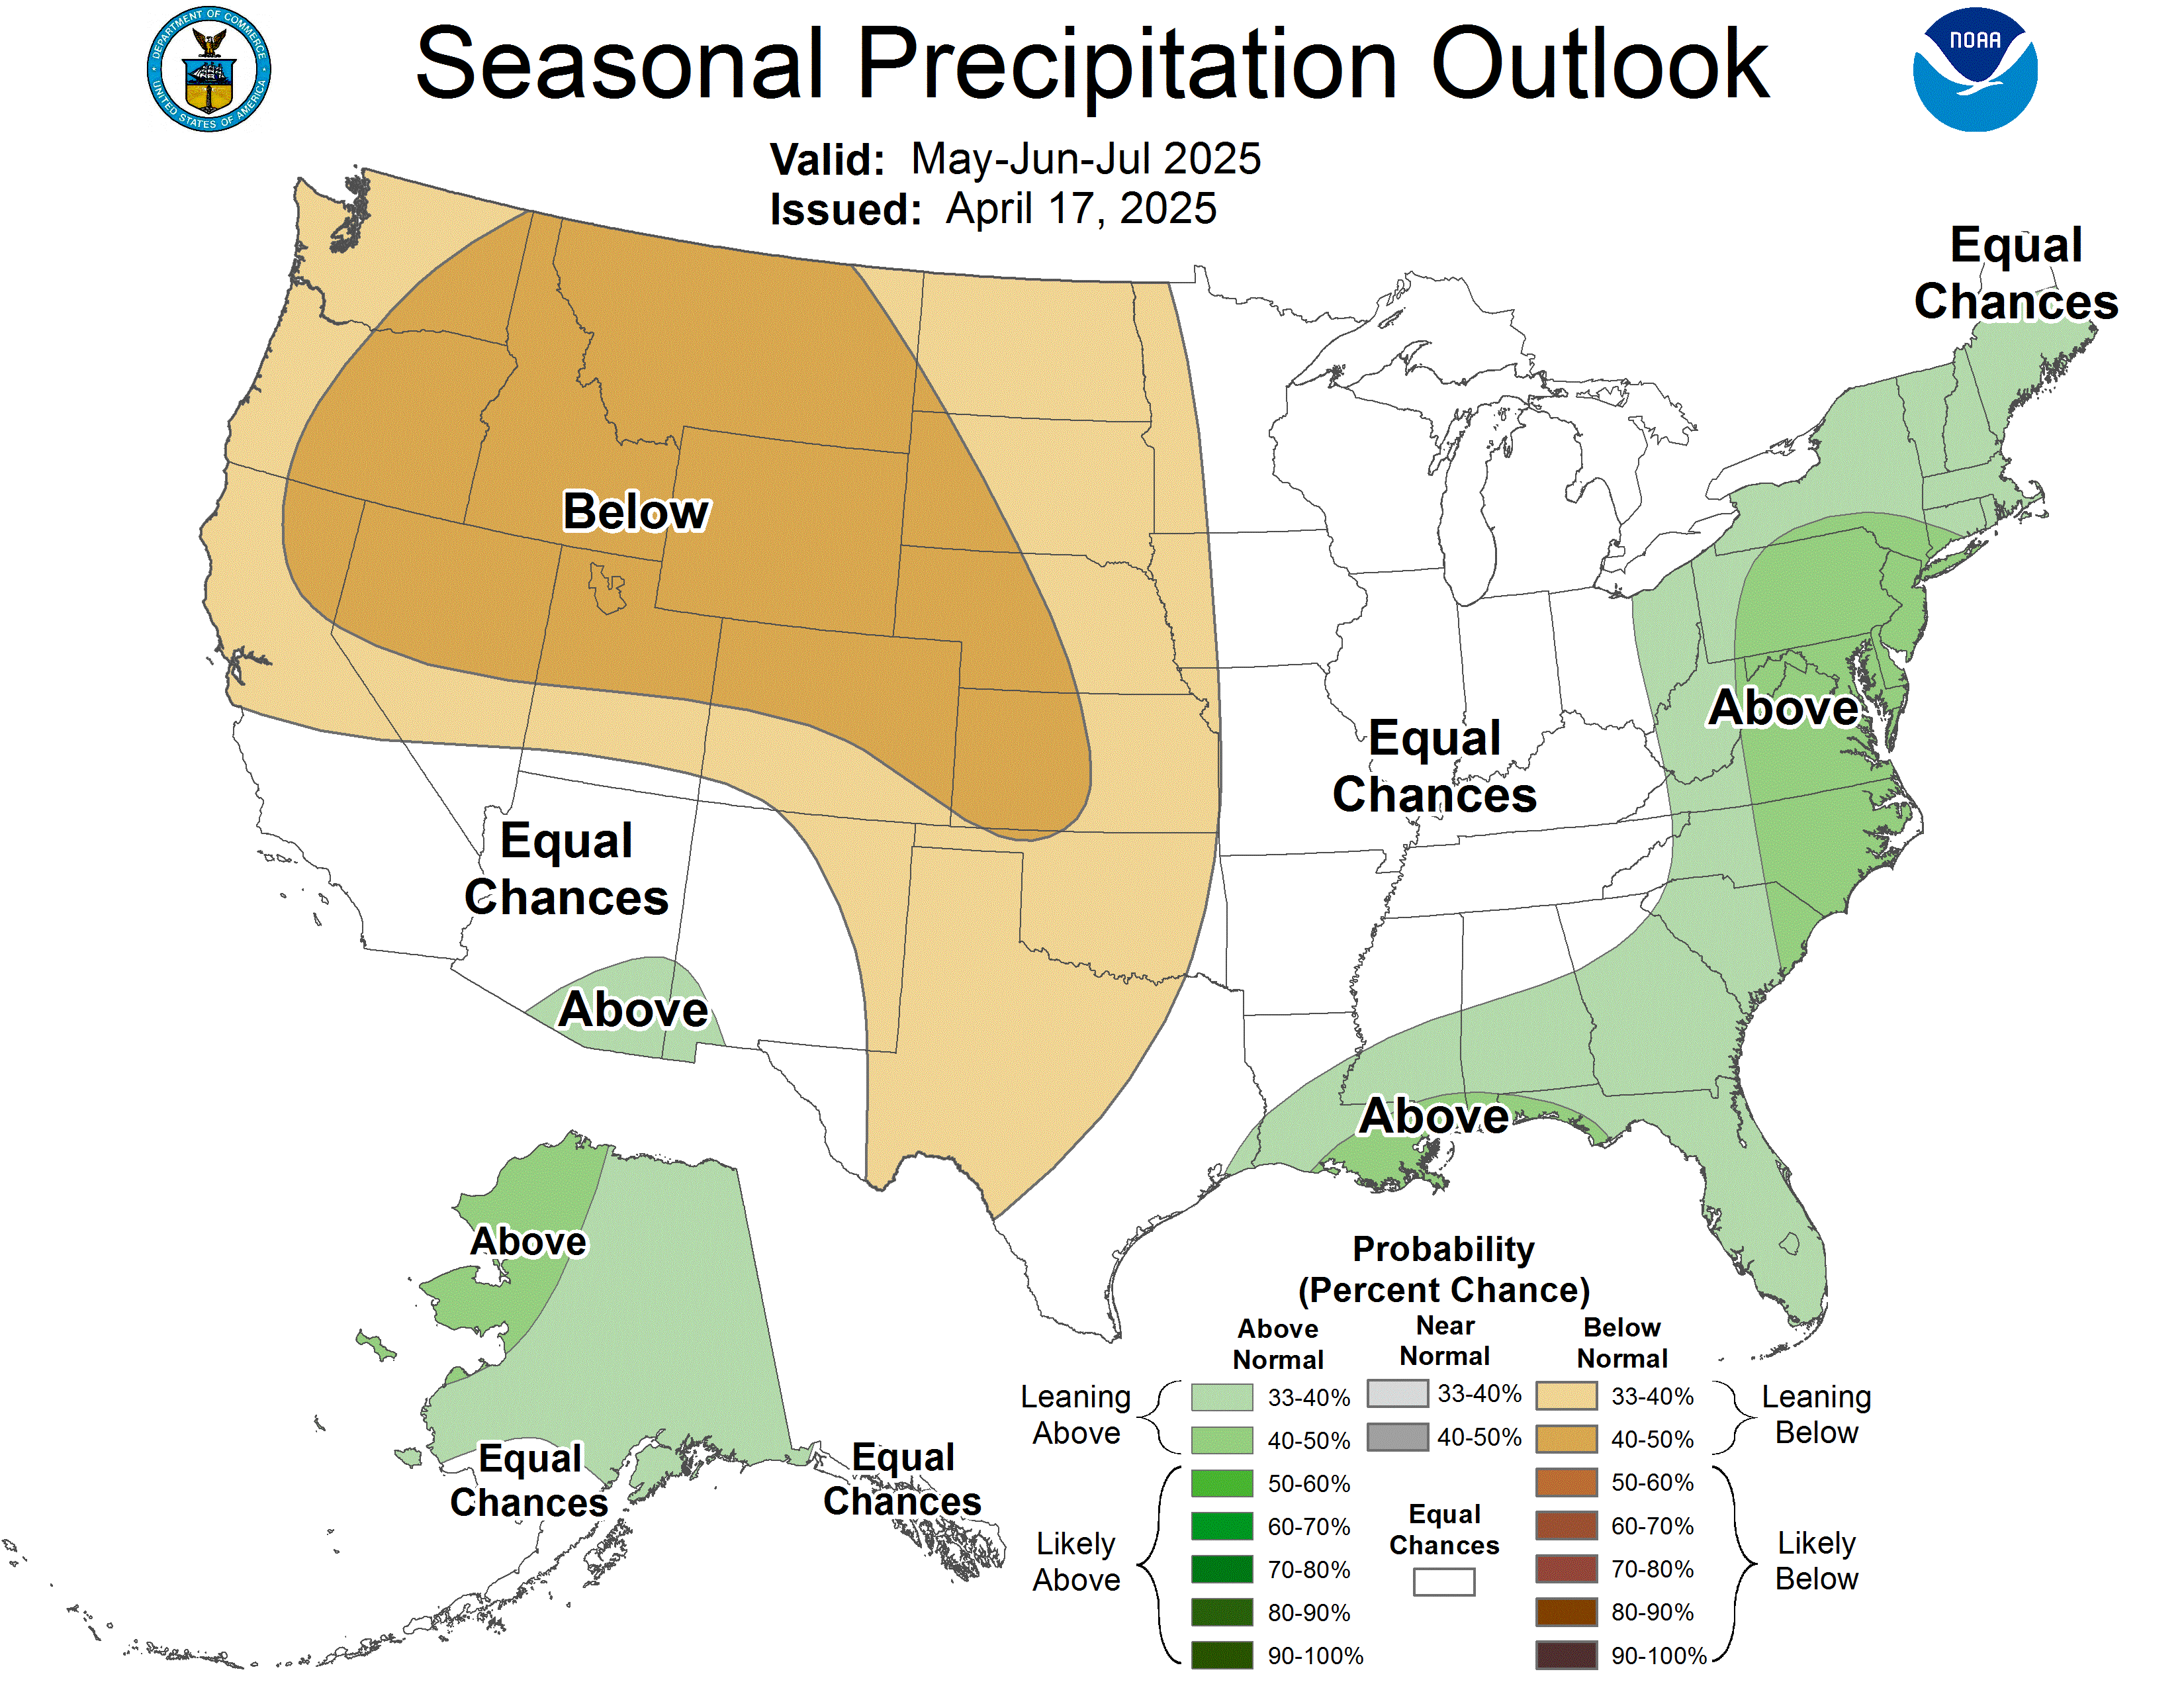
The NOAA Climate Prediction Center's outlook for fall, September through November, favors above normal temperatures across Florida and much of the U.S. Precipitation is leaning above-normal for the northern half of the state, with equal chances for above, below, and near normal precipitation in South Florida. Continued drought improvement or removal is likely.
*Click each map to view a larger image.
|
| |
Capital Report: May 1, 2026 (Florida wildfires), WFSU Public Media, May 1, 2026
It’s never been more hot in Florida than on these historic heat days, Fort Myers News-Press, July 22, 2026
Panhandle should be cooling but there's a prolonged heat wave instead, Pensacola News Journal, August 14, 2026
How Should You Prepare for a Super El Niño?, Time, August 31, 2026
Florida state Climatologist wants Floridians to be prepared for El Niño, FSU News, September 2, 2026
The U.S. just saw its warmest summer on record. See where extreme heat dominated, The Washington Post, September 10, 2026
| | |
June 11-12:
Northwest Florida Resiliency Seminar in Pensacola, FL
June 24-26:
Annual Meeting of the American Association of State Climatologists in Fairbanks, AK
July 13, 2026:
Alabama & Georgia Seed Associations Annual Conference, Sandestin, FL
August 17, 2026:
2026 Southern Peanut Growers Conference, Panama City, FL
| |
The Florida Climate Center is part of a three-tiered system of national, regional, and state climate offices, including NOAA's National Centers for Environmental Information (NCEI - in Asheville, North Carolina) and the Southeast Regional Climate Center (in Chapel Hill, North Carolina). The Florida State Climatologist and staff at the Florida Climate Center provide the following information and services to the people of Florida:
Climate Data
Historical weather observations for weather stations throughout the state of Florida. We are able to provide data for most stations from 1948-present.
Climate Information
Long-term historical averages for various stations, climate divisions, and the entire state.
Extreme Event Records
Information and analyses on extreme events such as freezes, droughts, floods and hurricanes.
Special Analysis
With their vast knowledge of El Niño, La Niña and climate variability, the State Climatologist and staff can offer expert insight into Florida's climate trends.
Outreach
Activities, presentations, and workshops that inform and educate the people of Florida about current and emerging climate issues. We also coordinate volunteers for the Community Collaborative Rain, Hail & Snow Network (CoCoRaHS).
| | | | |