|
AI Considerations Packet
by Jason Betzner, M.Ed.
At TTAC W&M, we are engaging special educators in responsible and ethical use of artificial intelligence (AI) in the workplace. In October 2025 and January 2026, we welcomed one-hundred educators and administrators to the School of Education to explore the new frontier of AI in special education.
Through breakout sessions and panel discussions, participants combined their expertise to develop some considerations. These are compiled in our AI Considerations Packet. This considerations packet is a living document that will be updated as new information, guidance, and resources emerge.
The packet highlights ways AI can support planning and student learning. In addition, it provides guidance on current best practices to make sure AI is being used in the most ethical, unbiased, and safe way possible. There are links to resources as well. When you’re ready, explore the packet and reach out to TTAC for coaching and support!
| | |
Intensify and Intervene in Behavior and Academics: When at First You Don’t Succeed
by Cathy Buyrn, M.Ed.
Inclusive school leaders understand that teaching and learning are trial-and-error processes that can frustrate teachers and students. The frantic pace of the school year and testing calendars can lead to panic and feelings of failure. No one performs well under those conditions. School leaders can create conditions that help teachers and students take struggles in stride and approach those struggles with a calm assurance (Tschannen-Moran & Tschannen-Moran, 2010) that allows for regrouping as part of the natural teaching and learning processes.
| | |
Do any of these feel familiar?
As part of the school improvement team, you’ve been tasked with reducing referrals in the hallway. You’ve implemented a new transition routine and the next task is to determine how effective it’s been. As the discussion begins, everyone seems to have a different opinion and some of those are voiced very strongly.
Or
You are in a grade-level meeting with your co-teaching partners discussing Jordan, who has shown a pattern of off-task behavior over the past few weeks, including getting up out of her seat and blurting out during instruction. After implementing a few strategies the team is determining next steps. However, the four of you are struggling to reach consensus on whether the intervention is having an impact on the targeted behavior.
Or finally,
Today is the second time the problem-solving team has gotten together to determine next steps for Aiden, a student who has been exhibiting off-task behaviors such as sleeping, putting his head down, and going to the nurse. With input from the team and family you hope to determine next steps. The problem is, team members have different opinions on what is most effective and without clear data, you are having difficulty determining next steps.
In each of these scenarios, data is foundational for effective collaboration and instructional decision-making. When it is presented in a clear and concise manner, teams are better equipped to implement the High Leverage Practices. In this edition of Link Lines we will highlight concrete and practical strategies to help you get the most out of your data to work smarter across all four domains: collaboration, data-driven planning, instruction in behavior and academics, and intensify and intervene as needed.
| | |
Data is foundational to effectiveness across the High Leverage Practice domains. We engage in problem-solving, instructional decision making, progress monitoring, and IEP and eligibility meetings, while also co-planning, consulting, and coordinating with stakeholders. Without solid data that’s presented in a clear manner, these efforts can quickly become inefficient, less effective, and at times, stagnant.
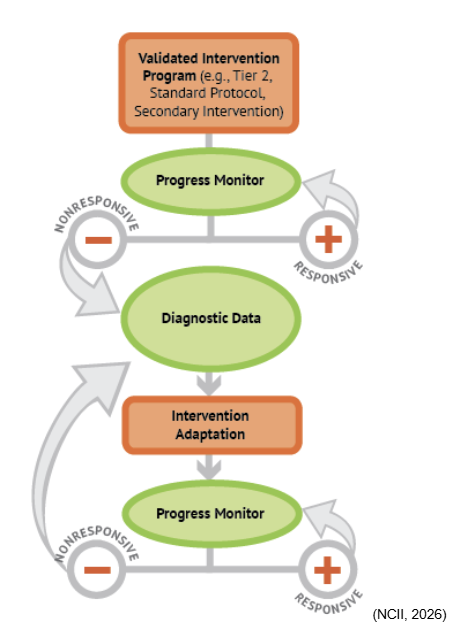
Let’s revisit Aiden’s scenario. As the team considers whether to intensify instruction, they turn to data-based individualization (DBI) to guide the design, delivery, assessment, and adaptation of intensive instruction. Take a look at the DBI steps below.
| | |
Step 1:
Deliver secondary intervention (tier 2) with fidelity
Step 2:
Collect and Review progress monitoring data with validated assessments
Step 3:
Review diagnostic data
Step 4:
Adapt Instruction
Step 5:
Continue progress monitoring
(Aceves & Kennedy, 2024.)
| | | |
Aiden’s team has completed Step 1 by implementing tier 2 interventions. Now, it’s time for Steps 2-5: collecting and reviewing the data to adapt instruction.
Let’s consider how this scenario might unfold in two different ways. As the team revisits Aiden’s progress and discusses next steps, the clarity and presentation of the data becomes critical. While you review these two different possibilities, think about how the conversations, decisions, and outcomes may differ when the data is well-organized and easy to interpret versus when it is not.
Scenario 1
The team reviews Aiden’s data as a list.
| | | Day of Intervention | Minutes Off Task During 40 Minutes of Instructional Time | | Day 1 | 22 | | Day 2 | 28 | | Day 3 | 34 | | Day 4 | 24 | | Day 5 | 21 | | Day 6 | 22 | | Day 7 | 21 | | Day 8 | 15 | | Day 9 | 25 | | Day 10 | 19 | | Day 11 | 14 | | Day 12 | 18 | | Day 13 | 16 | | Day 14 | 23 | | Day 15 | 22 | | Day 16 |
| | Day 17 |
| | Day 18 |
| | Day 19 |
| | Day 20 |
| | | |
While the team reviews this data, you hear conflicting comments like:
- “It looks like he’s spending less time off task as the days go on. I think the intervention is working as-is and just needs more time.”
- “It’s been three weeks of this intervention, and the last two days have been two of the highest numbers. This isn’t working.”
| | |
Scenario 2
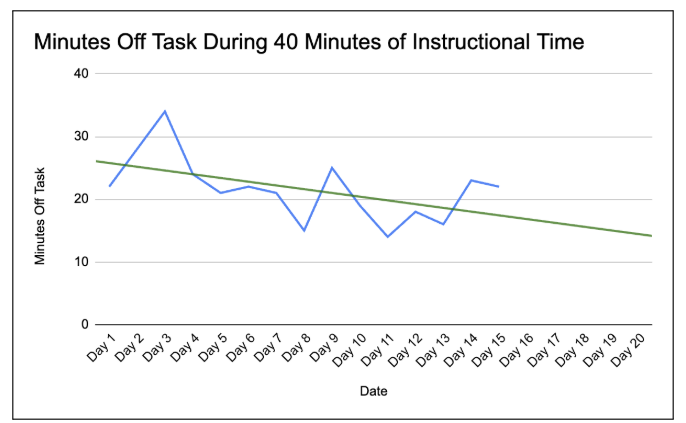
Now, consider the same data presented in a clear and concise manner as demonstrated below.
| | |
In this graph, we see Aiden’s data displayed in blue. Along with the data, there’s a green line showing the statistical analysis of Aiden’s data so far. This green line is called a trendline, and it uses the student’s past performance to predict where their performance is likely to be if the same progress continues.
Using this graph, conversation around the data can be more productive. You may hear more consensus during conversation, like:
- “There’s been some ups and downs, but it looks like Aiden is making progress.”
- “If he continues with this intervention, the data shows he’s likely to keep improving.”
Bringing data to life as a graph is actually easier than you might think!
With a few simple tools, you can transform the data from Scenario 1 into a clear graph in just a few minutes. This creates a shared, visual foundation for more informed conversations. Data visualization supports stronger implementation across the High Leverage Practices by improving collaboration, guiding data-driven decision making and helping teams make more precise instructional decisions.
| |
|
For a quick guide to get started, you can learn to make a simple graph with a trendline (like the one used for Aiden) on Google Sheets and Excel.
If you want to start or improve your ability to graph using student data to make decisions, check out our new self-paced Google Classroom course created by Dr. Mackenzie Turbeville-McCorry!
In short, digestible videos, you can learn how to:
- create and customize graphs that make data easier to understand
- interpret and explain progress using graphs to families and school-based teams,
- use more advanced graphing techniques to make graphing even more helpful
| | | | |