|
|
|
🔍 A New Use Case The Root Imager isn’t limited to root imaging?
|
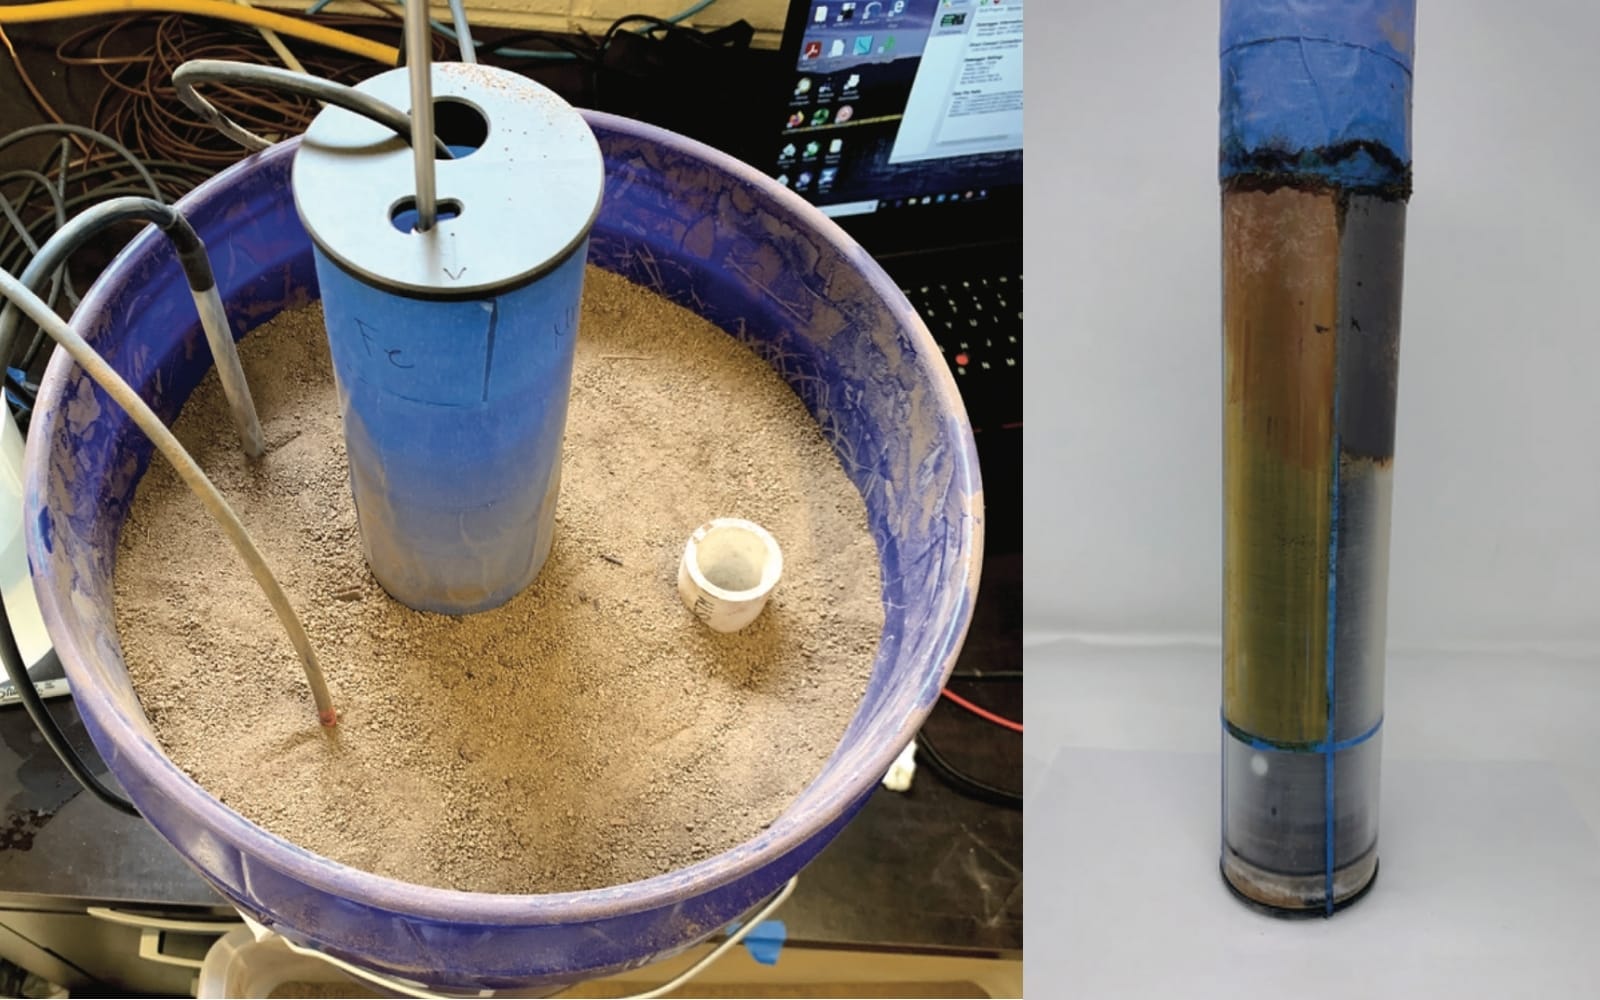 |
Researchers at Auburn University recently used the Root Imager to continuously monitor, in real time, how wetland soils shift from oxidized to reduced conditions.
Using the camera inside a clear, oxide-coated tube, they replaced the traditional multi-tube Indicator of Reduction in Soils (IRIS) method with a single automated setup. Hourly images captured the removal of iron and manganese coatings as microbial activity altered the soil’s chemistry, providing data every hour rather than every week.
Their findings showed:
Manganese reduction began within one day of soil saturation. Iron reduction followed about 4 days later. Complete reduction occurred within two weeks, all recorded automatically by the CI-600.
This experiment highlights how the CI-600’s precision imaging and automation can support environmental monitoring, soil chemistry, and sustainability studies, well beyond its original design for root analysis. |
| Check out the full research here |
|
|
|
Tool Tip 🌳 3 Persistent Myths About the Plant Canopy Imager |
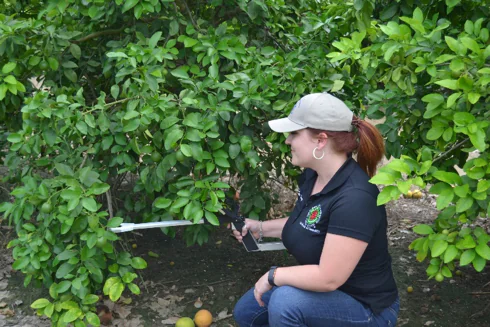 |
Even seasoned users sometimes underestimate what the Plant Canopy Imager can really do. Here are three common misconceptions we still hear in the field, and what’s actually true.
Myth 1: It’s only useful for forests.
Not quite. While it’s built for canopy structure analysis, the same imaging process applies to crop systems, restoration sites, and managed grasslands. Anywhere you need LAI, canopy cover, or gap fraction data, it performs just as well as in a forest stand. Measurements as low as 2 inches!
Myth 2: You still need destructive sampling for accuracy.
That’s old thinking. The imager’s fisheye optics and instant LAI computation deliver field-validated results without removing a single leaf.
Many users now use it to calibrate or even replace their traditional destructive methods.
Myth 3: It’s just a snapshot tool.
Far from it. With GPS tagging and data export, canopy data can be tracked seasonally, compared across plots, or integrated into larger ecosystem models, making it a powerful monitoring tool, rather than just a camera.
The takeaway: The Plant Canopy Imager has evolved from a measurement tool into a complete canopy-monitoring system, portable, precise, and ready for whatever vegetation you work with next. |
| Find out more about the Plant Canopy Imager |
|
|
|
Webinar on Thursday! How to Verify Ethylene Control in Your Storage Environment with Felix Instruments |
 |
Still relying on slow lab tests to validate your ethylene systems? There’s a faster, data-driven way.
Join Felix Instruments for a live demonstration on how continuous ethylene monitoring simplifies system validation, reducing time, manual steps, and uncertainty.
See real-world examples of how real-time ethylene data helps teams prove performance with confidence.
🗓 October 30th, 2025
🕘 9 AM PDT |
| Sign up for the webinar while there are still spots available! |
|
|
|
|
Latest Articles & Resources |
|
|
|
|
 |
What is the Importance of Leaf Area Index? |
Leaf area index (LAI) is one of those deceptively simple measurements that tells scientists a lot about how the planet breathes. Defined as the total leaf surface area per unit of ground area, LAI links vegetation structure to vital ecosystem processes, photosynthesis, carbon storage, water cycling, and even climate regulation.
This article explores how LAI varies across ecosystems, from dense plantations with high canopy cover to sparse desert landscapes, and why temperate forests often outscore tropical ones. With tools like the Plant Canopy Imager, researchers can measure LAI non-destructively in the field, helping track how forests and crops respond to shifting climates and management practices. |
| Explore Global LAI Insights |
|
| Explore Non-Destructive LAI Measurement Tools |
|
|
|
 |
What Are Brix Measurements and Are They Crucial in Fresh Produce? |
How sweet is sweet enough? In the world of fresh produce, that question has a number, and it’s called °Brix. Originally devised by Adolf Brix in the 1800s, this simple measure of soluble solids (mostly sugars) is now a global shorthand for flavor, freshness, and market value. From the field to the factory, Brix readings guide everything from when to harvest to how to price a crop or blend a juice.
But sweetness is only part of the story. This week’s article explores how Brix has become a cornerstone of modern quality control, and why non-destructive, Near-Infrared tools are transforming the way growers and processors monitor produce. It’s a reminder that behind every perfect peach or balanced wine lies the quiet precision of a few well-measured degrees. |
| See How Brix Shapes Quality Across the Supply Chain |
|
| Check Out the Tool That Measures Brix in 12 seconds! |
|
|
|
 |
How Does Elevated Carbon Dioxide Affect Leaf Area in Plants?
|
When atmospheric CO₂ rises, plants often respond by growing more or larger leaves, a process that boosts photosynthesis and biomass production. Yet this “CO₂ fertilization effect” isn’t permanent. Over time, leaf area growth slows as plants adjust or face limits in water, light, or nutrients.
This week’s article unpacks the science behind these changes, from the cellular mechanisms that expand leaf size to the environmental factors that constrain it. Using precision tools like the Portable Leaf Area Meter, researchers are uncovering how elevated CO₂ levels are reshaping vegetation, and what that means for ecosystems in a warming world. |
| Read the Full Study on CO₂ and Leaf Growth |
|
| See the Tool Used to Quantify CO2 Levels in Plants |
|
|
|
 |
What Is an Ethylene Monitoring System and Why Is It Critical for Fresh Produce?
|
Ethylene is the invisible hand behind ripening; too little, and the produce stays green; too much, and it turns to waste. That’s why ethylene monitoring has become the quiet hero of postharvest management. A whiff of this gas, just a few parts per billion, can trigger a chain reaction of overripening, decay, and loss across storage rooms and shipping containers worldwide.
This week’s article looks inside modern ethylene monitoring systems: networks of ultrasensitive sensors and IoT-connected controls that detect and regulate ethylene in real time. From pinpointing a single apple’s emissions to automating entire cold rooms, technologies are redefining freshness, one molecule at a time.
|
| Discover Smart Ethylene Monitoring Solutions |
|
| Explore Tools for Ethylene Measurement |
|
|
|
|
 |
Schedule a Live Demo |
Use the link below to schedule a live instrument demonstration with an application scientist. Get an overview of functionality, see how the tool can be used in your specific application, and get your questions answered in real-time. |
| Let's talk about an instrument! |
|
|
|
|
|
|


