Banner for the Landsat Science News Digest newsletter. The graphic features the name of the newsletter in white text on top of a Landsat image of Svarlbard. The NASA meatball logo is on the left side of the graphic and the bottom right reads, "July 2026".

In Pursuit of Precision
July 31, 2026

A photograph of John Barker holding an award.

John L. Barker, who passed away on July 6, 2026, at age 88, was a seminal force who fundamentally transformed Landsat into a rigorous science mission through his relentless pursuit of precision remote sensing calibration standards.


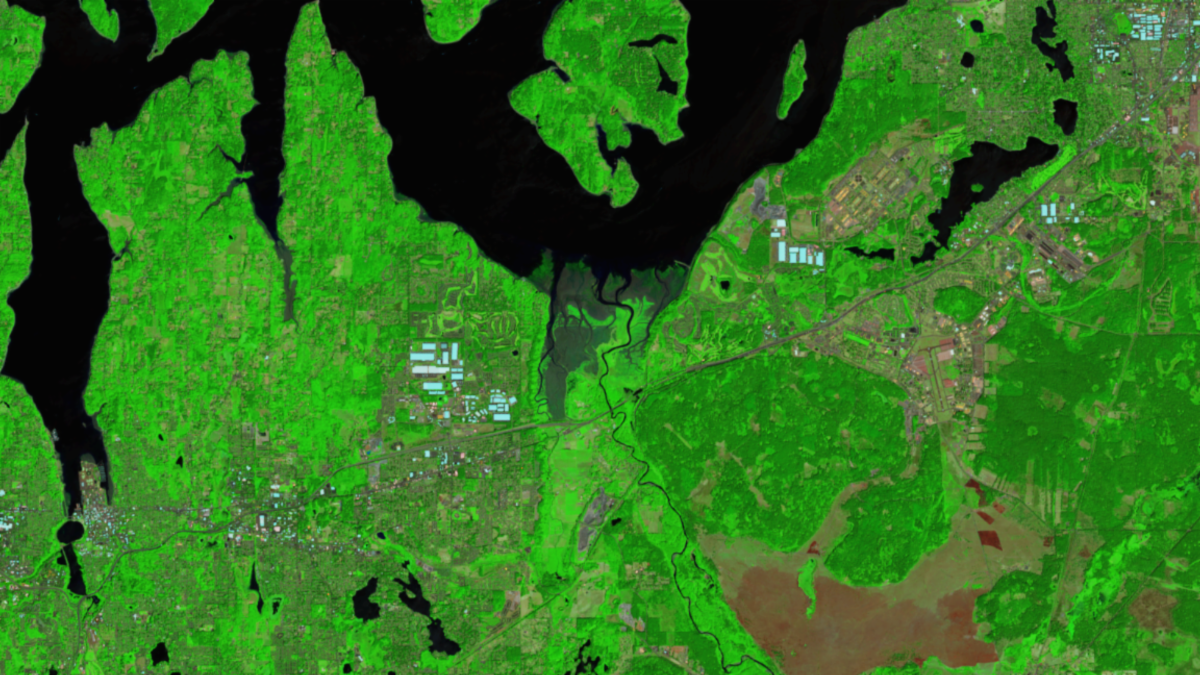
This false-color image of the Nisqually National Wildlife Refuge was acquired by Landsat 9 on August 1st, 2024. In this combination, vegetation appears bright green, water appears dark blue, and bare earth appears tan.

July 30, 2026

Moving Marshes in the Puget Sound


The Billy Frank Jr. Nisqually National Wildlife Refuge is tucked southeast of Seattle, among the twisting inlets of the Puget Sound. In 2008, a major restoration project removed the Brown Farm ditch to restore natural tidal flows to the Nisqually River Delta estuary.


July 17, 2026

NASA Releases Landsat 10 Spacecraft Request for Proposal


The Landsat 10 Spacecraft Request for Proposal (RFP) is available for review via SAM.gov as of July 14, 2026. Proposals are due August 13, 2026 at 1:00 PM EDT. Expected to launch in 2031, Landsat 10 will continue and expand the Landsat legacy as the longest space-based record of Earth’s land surface.


July 13, 2026

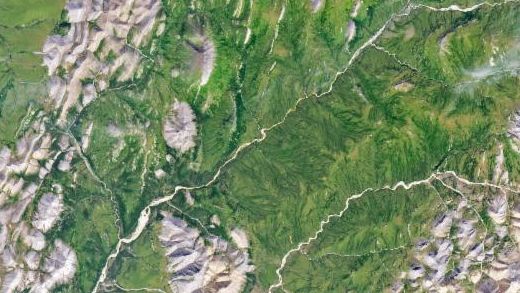
Wild, Scenic, and Increasingly Rusty

Source: Lindsey Doermann, NASA's Earth Observatory


Orange streams are now being spotted in hundreds of watersheds in permafrost areas throughout Alaska’s Brooks Range. Scientists used decades of Landsat observations to study this phenomenon.

 
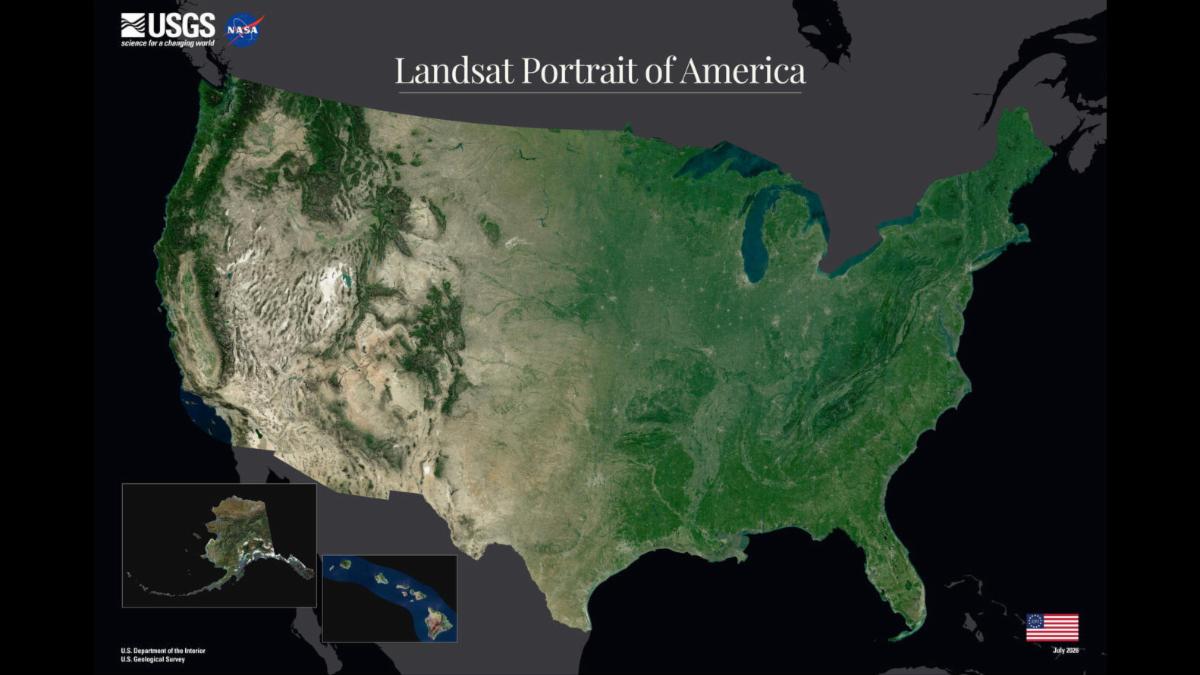
A screenshot of the front of the USGS 250 Portrait of America poster. It features a satellite mosaic of the United States including Alaska and Hawaii and has a black/gray background.

July 1, 2026

America at 250, Seen from Space

Source: USGS EROS


To mark the 250th anniversary of the United States, the U.S. Geological Survey (USGS) has released a new portrait of the nation from space. The mosaic was built by analyzing billions of Landsat 8 and Landsat 9 pixels from the data archive.


PUBLICATION SPOTLIGHT


Satellite observations reveal widespread alteration of river thermal regimes by US dams


| Ellis et al., 2026


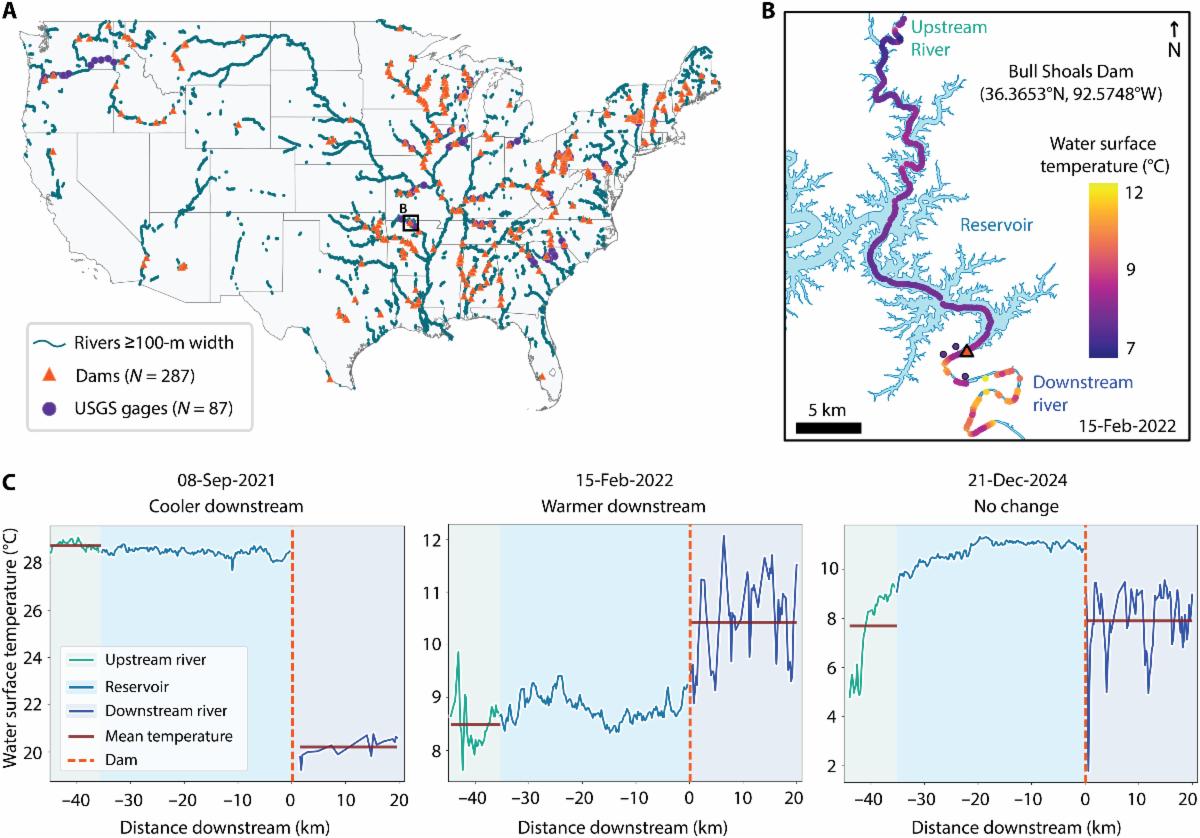
Dams fundamentally alter the ecosystems around them, creating reservoirs and changing how rivers flow. Ellis et al., 2026, published in Science Advances in July, highlights how large dams tend to warm downstream river temperatures across the United States. To overcome the spatial limitations of traditional in-situ streamflow gages, researchers leveraged the Landsat thermal data to analyze river surface temperature up- and downstream of 287 large dams between 2013 and 2024. They revealed that 71% of the river profiles experienced altered downstream temperatures. The majority of these rivers displayed warmer downstream temperatures, which tended to remain high for at least 20 km post-dam. Dam type also played a role; 91% of extreme temperature differences occurred downstream of dams with reservoirs. With this national-scale, all-season analysis, water managers can better understand and mitigate the impacts of dams on riparian ecosystems and fisheries. 

A three-part figure illustrating the impact of dams on river water surface temperatures.  Panel A shows a map of the contiguous United States, highlighting rivers 100 meters or wider in teal, the locations of 287 dams as orange triangles, and 87 USGS stream gages as purple dots. A small box labeled "B" highlights a specific region on the Missouri-Arkansas border.  Panel B is a detailed map of the area outlined in Panel A, focusing on the Bull Shoals Dam and its surrounding reservoir. A color gradient overlays the river path, showing water surface temperatures ranging from 7 degrees Celsius (dark purple) to 12 degrees Celsius (yellow) on February 15, 2022. The map indicates an upstream river flowing into the reservoir, the dam location, and the downstream river segment.  Panel C contains three line graphs plotting water surface temperature (in degrees Celsius) against the distance downstream from the dam (in kilometers). The dam is marked at the 0 km point by a vertical dashed red line.

River surface temperature longitudinal profiles for large, obstructed rivers in the United States. (A) Map of rivers ≥100-m wide with dams and in situ temperature sensors at streamflow gages analyzed in this study. (B) Example of a Landsat-derived temperature profile with corresponding dam and USGS streamflow gages. (C) Three example profiles exhibiting different relationships between river temperatures up- and downstream of the dam. Image credit: Ellis et al., 2026

Find more selected Landsat publications on our website.


NASA's Earth Observatory

Selected Landsat Images

July 21, 2026

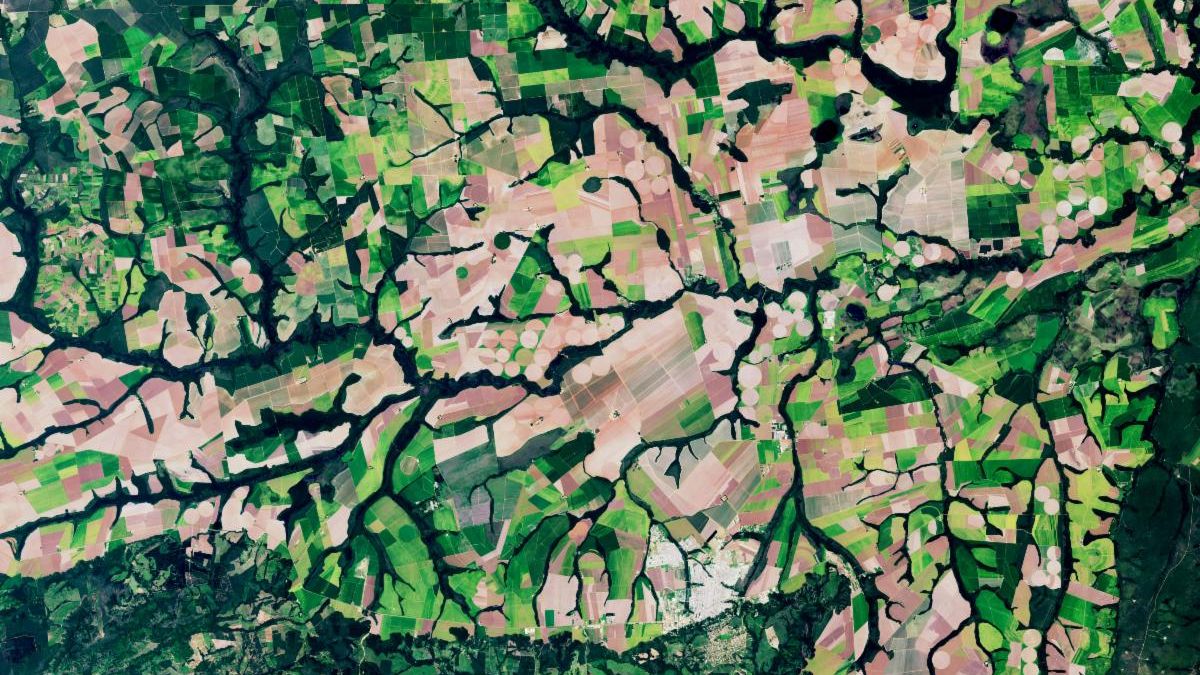
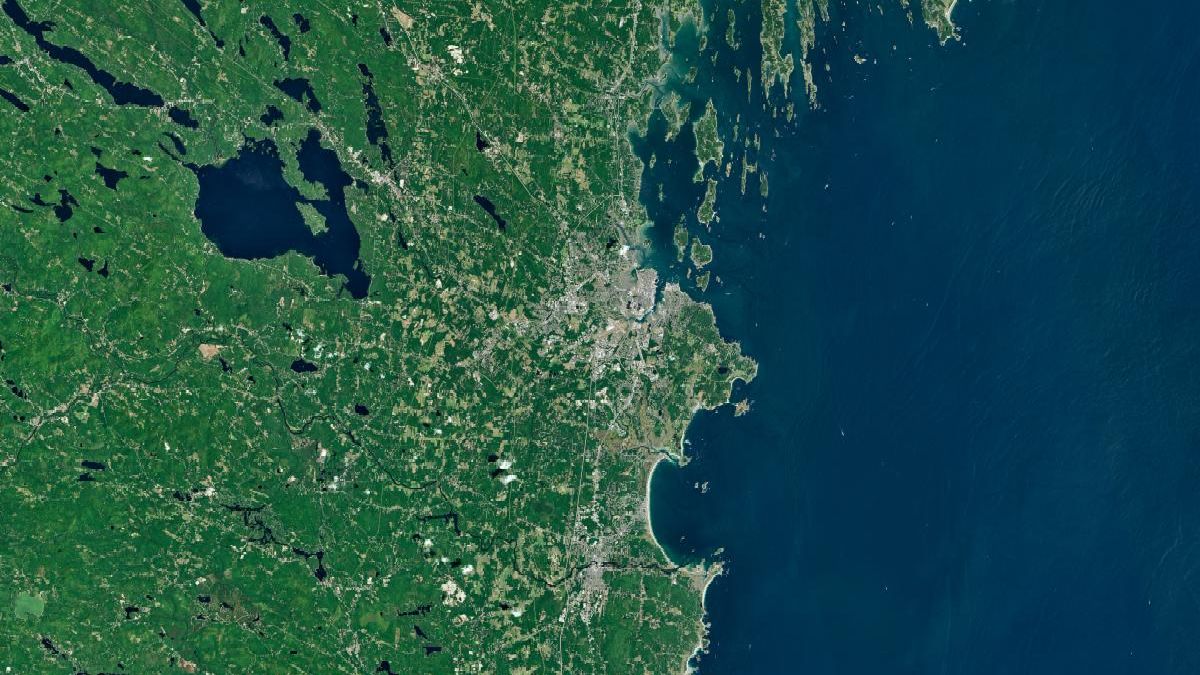
Why Maine’s Sandy Shorelines Turn Jagged


Differences in the underlying bedrock and how rivers distribute sediment make the coastlines west of Portland look unlike those northeast of the city.

A satellite image of the Maine coastline highlights smooth, sandy beaches near Saco Bay on the left and the rocky, jagged coastal features near Casco Bay on the right.

July 17, 2026

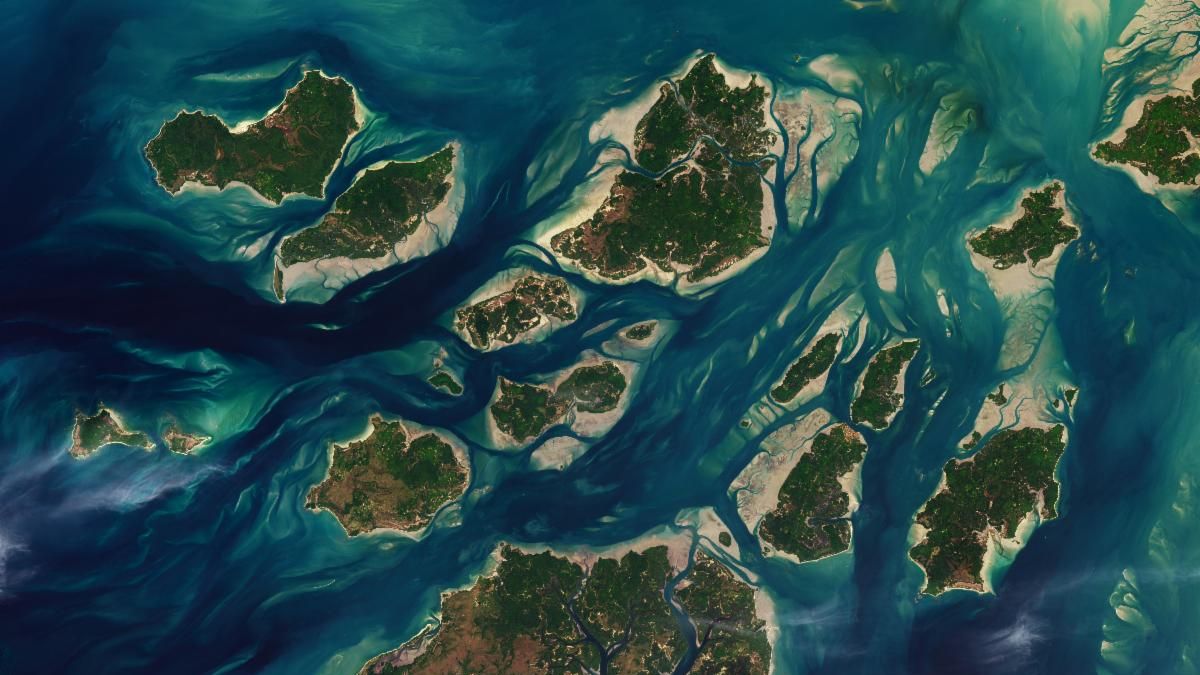
A Tide-Fueled Trove of Biodiversity in Guinea-Bissau


The expansive mudflats, sandy beaches, and mangrove forests of the Bijagós archipelago support an array of migratory shorebirds and large numbers of sea turtles.

A satellite image shows a cluster of green islands surrounded by beige sand flats and networks of channels full of dark blue water.

July 8, 2026

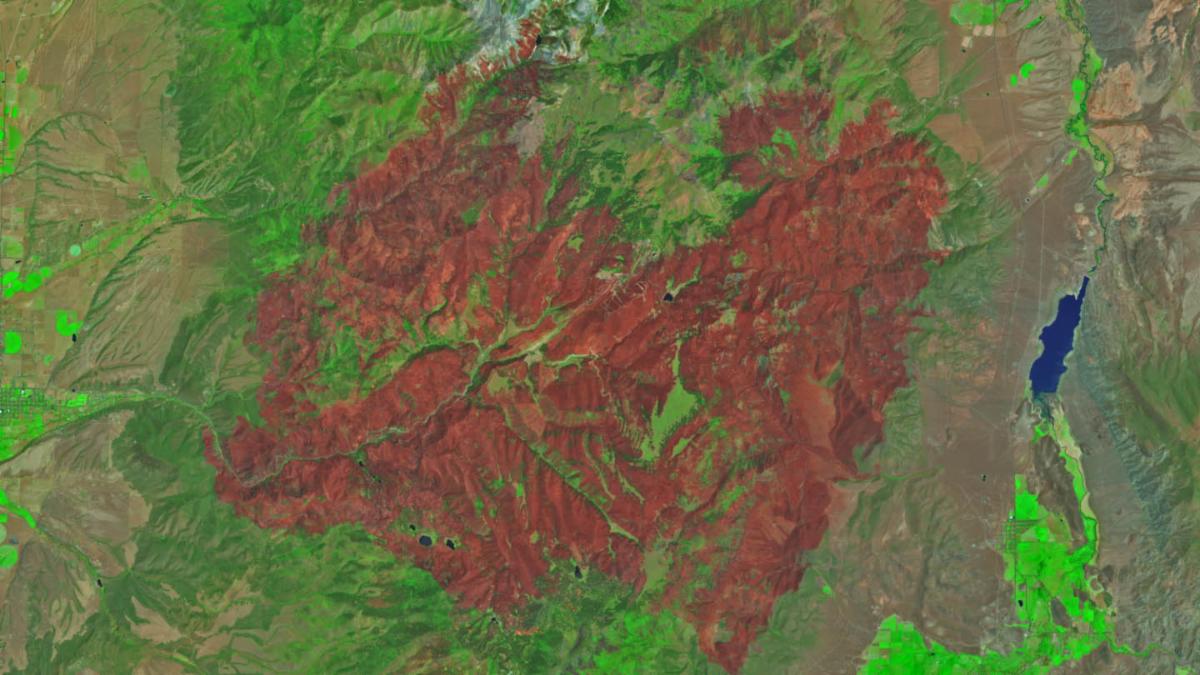
Cottonwood Fire Chars Utah


The blaze burned more than 150 square miles and swept through parts of a ski resort.

An image of a burned area shows a large brown patch spanning much of the image in an image acquired after the fire on June 29, 2026.

July 6, 2026

Examining Algal Blooms in Blue Mesa


Using satellite data, researchers connected harmful algal blooms with warm water and low water levels at one of Colorado's largest reservoirs.

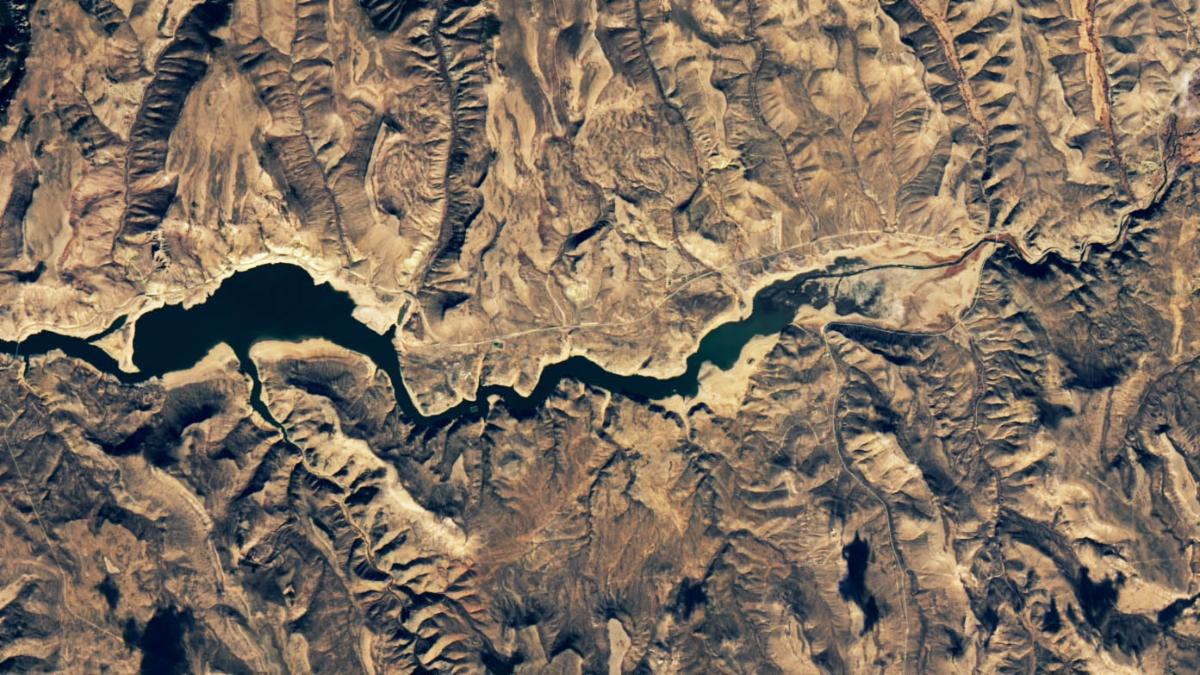
An image that shows the Blue Mesa Reservoir in November 2021, when water levels were much lower and its color was much greener.


AGU26: Submit Abstracts to the Following Sessions

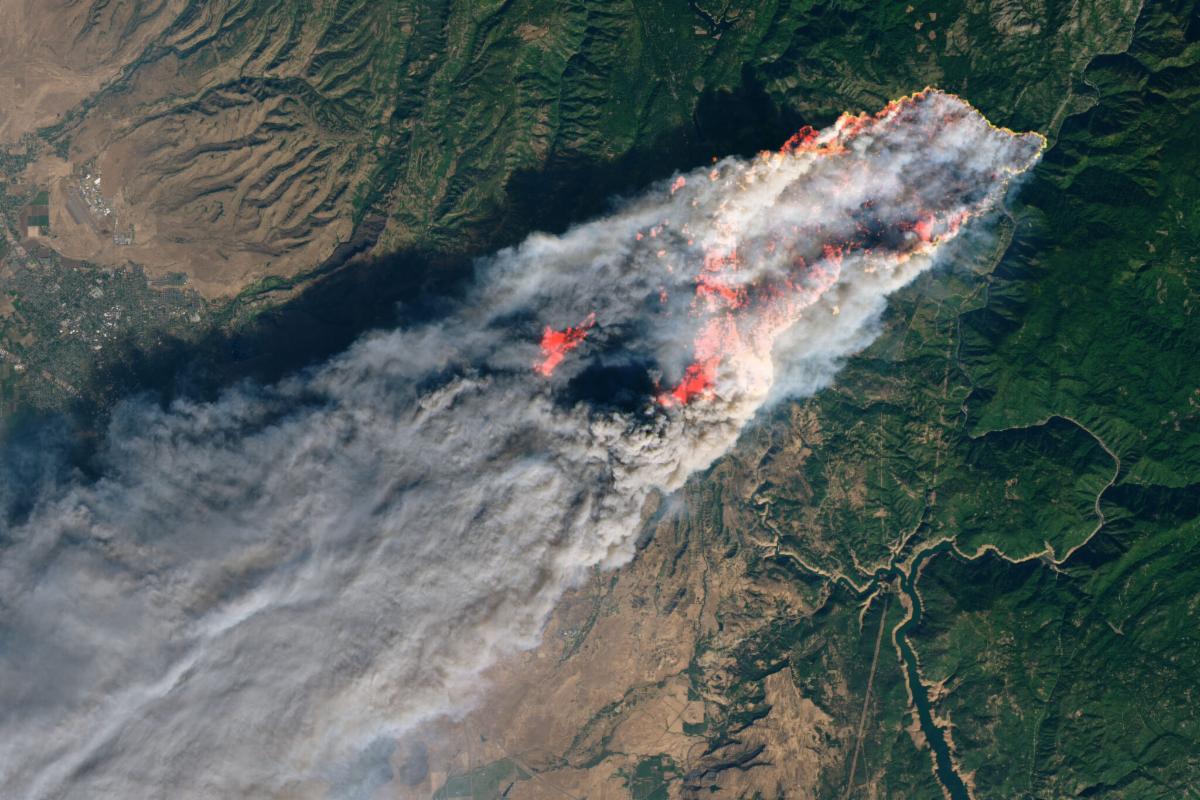
Landsat image of California's Camp Fire activity burning. A shortwave-infrared signature is overlaid on top of a natural-color composite. Active fire is red, healthy vegetation is green, and bare earth is tan. Smoke from the fire is gray.

Evolving Science and Applications of Landsat

This session examines how Landsat data support operational decision-making and policy-relevant outcomes. We invite contributions demonstrating innovative multi-sensor fusion, advances in uncertainty characterization, and the application of cloud computing and machine learning to scale Landsat-based analyses for the benefit of society.


+ Abstracts due Aug 5

Accelerating Impact: User‑Driven Earth Observation Solutions from the Satellite Needs Working Group

The Satellite Needs Working Group (SNWG), a U.S. Government inter-agency organization, identifies Earth observation needs across U.S. federal agencies. In response, NASA develops a wide range of solutions that benefit those agencies and the Earth science community. This session invites presentations from across the community on their applications of SNWG solutions.


+ Abstracts due Aug 5


Did someone forward this newsletter to you? Subscribe here if you'd like to be on our mailing list.


science.nasa.gov/landsat