| | |
MONTHLY NEWSLETTER
November 2026
| |
Preserve Calavera Supporter
| |
Please vote NO on 45 and No on Measure S
| | |
Transportation, home energy, diet and goods and services are the areas that impact your everyday carbon footprint. Not everyone has the option of changing their mode of transportation or home energy system, but diet choices can have more flexibility and simple substitutions can make a big different in your footprint.
It is estimated that one third of all human-caused greenhouse gas emissions is linked to food. And every time you eat a meal, you have a new opportunity to make a difference.
| | |
What is a Carbon Footprint?
It is the amount of carbon dioxide, and other greenhouse gases that we emit into the atmosphere as result of our daily living. Although it is called a “carbon” footprint, GHGs also include non-carbon gases such as nitrous oxide. Carbon dioxide makes up 75-80% of our GHG emissions.
The release of too much GHG is causing global warming and climate change.
| | It turns out that making some simple substitutions in your diet can often make a big difference in your carbon footprint. | | |
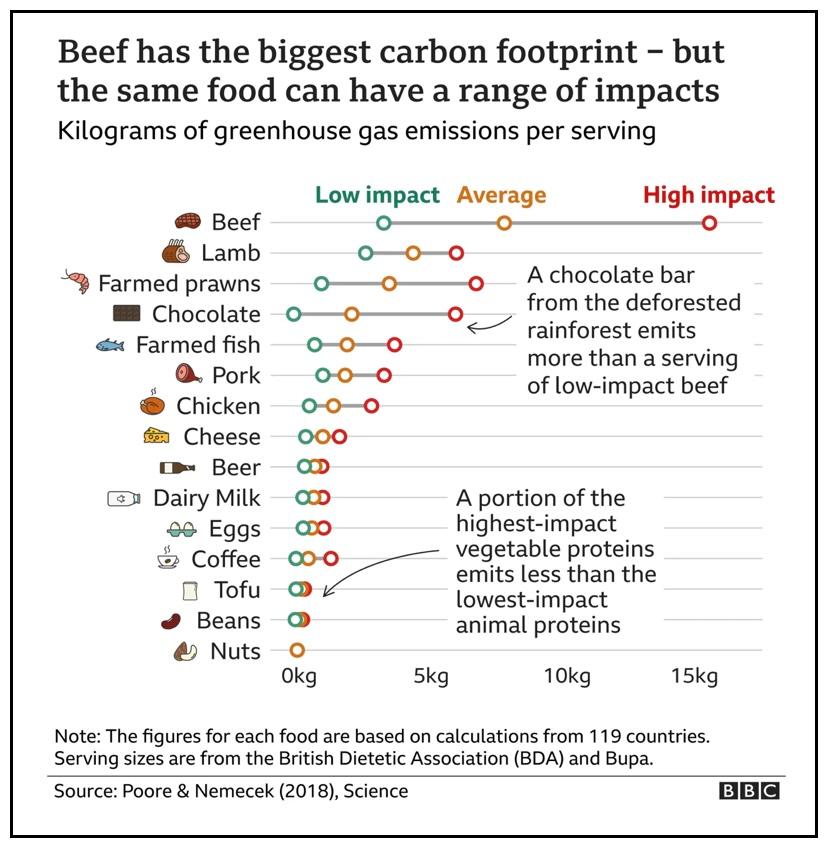
A lot of factors are at play when we examine the carbon footprint for various foods; it's complicated. But overall, animal-based foods tend to have a higher footprint than plant-based.
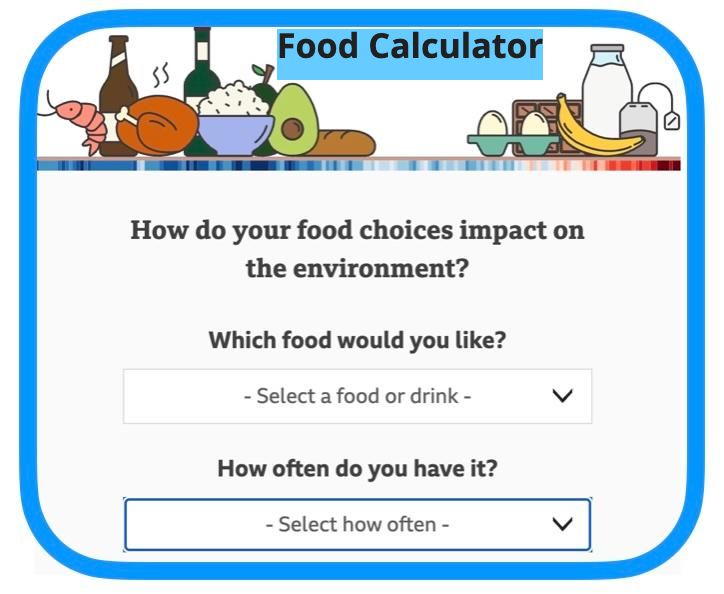
You can get a general idea of various food footprints by using the food calculator link at right:
But as you can see in the graphic below, carbon footprints can vary dramatically between similar products based on cropping systems, processing and other supply chain processes, the distance and mode of transport to market, and emissions associated with the sale of products.
| | | | | |
The average carbon footprint per person worldwide is at about 4.5 metric tons (1 metric ton = 1000 kg = 2205 lb) of CO₂ per year, but there is also a large imbalance:
- United States: around 14 to 16 tons per person per year
- European Union average: 6 to 7 tons
- China: about 8 tons
- India: 1.8 tons
-
Global target for sustainability: around 2 tons (SOURCE)
| |
Since about ⅓ of our footprint is linked to diet, that would translate into around 5 tons (5000kg) per year (in the US).
1 vegan day per week (52 days a year) can save nearly 143 kg of CO2 per year.
| | And there is the Elephant in the Room: FOOD WASTE! | | |
The U.S. Department of Agriculture estimates that over one-third of the food produced in the United States is never eaten, wasting the resources used to produce, transport, process, and distribute it. And much of it is sent to landfills, where it breaks down and generates methane.
Methane is a GHG super pollutant that has 84 times more heat trapping power than carbon dioxide. It is known as a short-lived climate pollutant since it does breakdown in the atmosphere within 10-12 years. CO2 can remain in the air for centuries.
| | |
Composting versus Landfill
When organic food waste is broken down in a landfill, the nutrients are trapped and a large amounts of methane and other GHGs are released. Composting allows the nutrients to be fully recycled while releasing only small amounts of GHGs.
To reduce methane pollution and other short-lived climate pollutants, California enacted SB 1383 in 2016. Its goal is to divert organic food waste from landfills so it can be composted. The bill also increases the recovery of still-edible food that is sent to food recovery organizations rather than ending up in a landfill. You can find out more at the CalRecycle website.
| | |
The impact of SB1383 is evident each time you put out your waste for collection outside your home. The food waste and other organics that was thrown in the gray landfill container can now be added to the green waste bin for composting.
The City of Carlsbad's What Goes Where Video explains what can be composted under SB1383. You can find out more from your city's waste management service.
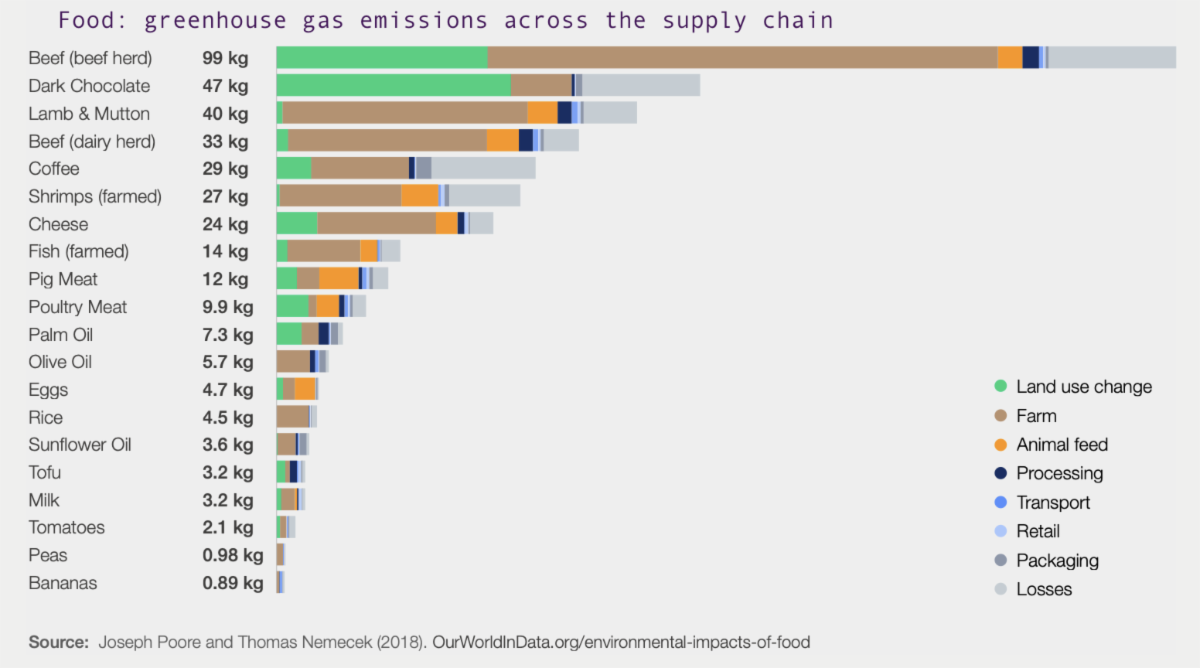
| | | How does Buying Local Impact the Carbon Footprint of Foods? | While there is a common perception that buying locally reduces one's carbon footprint, this isn't always accurate. The environmental impact of food is determined by multiple factors, including how they are produced, not just how far they travel. This can be visualized in the graphic below. Data shows that transportation accounts for only a very small amount of the total carbon produced by food. (Read more: Perceptions vs Evidence –Buying Local) And as we consider GHG emissions, we must also considered the impacts of pesticide use and agricultural expansion through deforestation— but we will have to save that for another newsletter. | | |
There are still important values in buying locally.
This is best summed up in an article by Earth.Org: How Important Is Eating Locally When Aiming for a Low Emission Diet? Examples of these include reduced pollution from fumes released from transport, less plastic waste from reduced packaging, less disturbance to aquatic life from cargo ships, supporting local economies, and producing fresher and more nutritious food. Read More
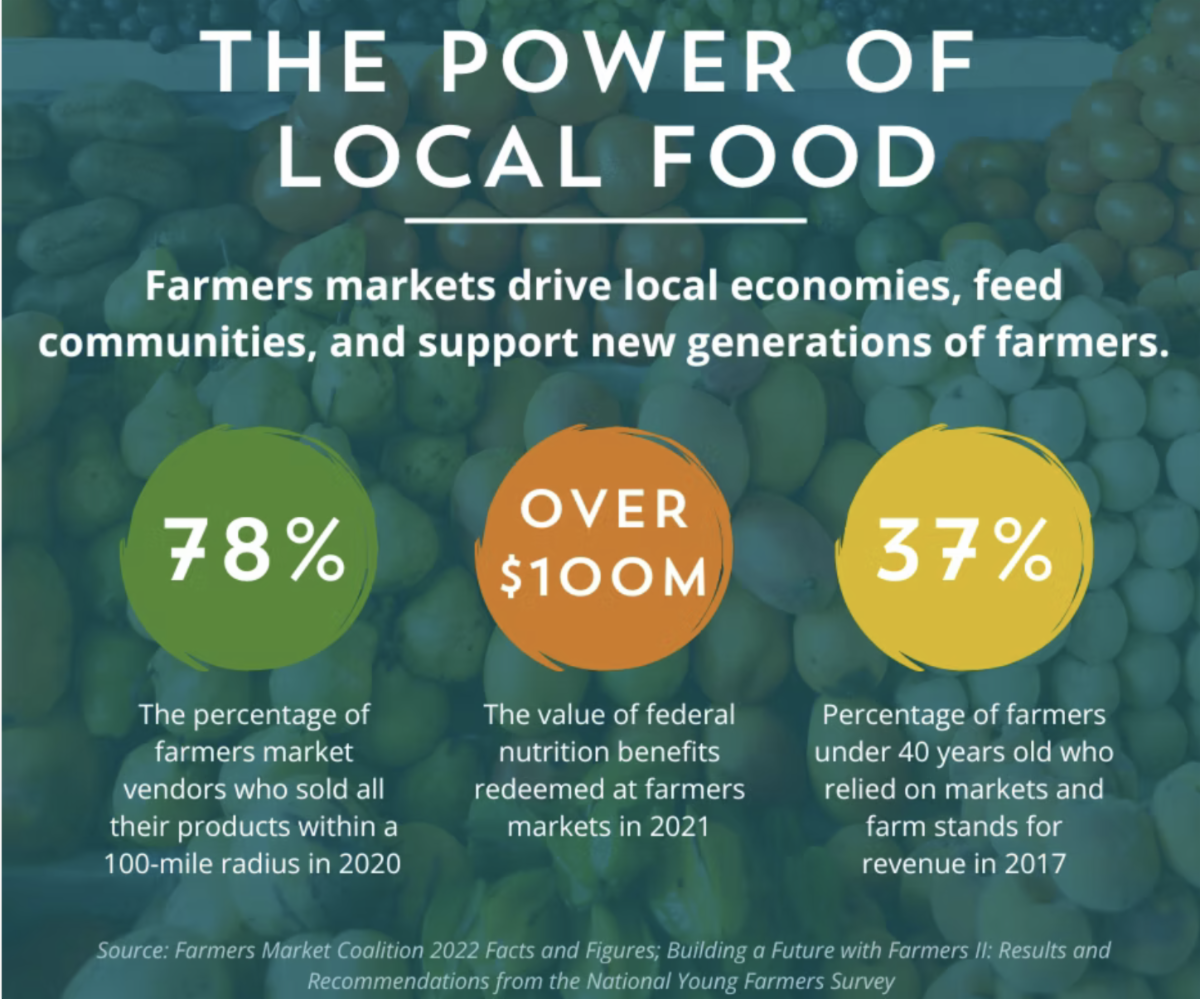
We have the opportunity to support local producers and businesses; including our farmers markets and Community Supported Agriculture (CSA) boxes and community farms. There is power in local food.
| Since around one-third of our carbon footprint is linked to food, modifying one's diet is one of the easiest ways to lower your footprint. Living along the coast, we have all been witnessing the effects of climate change first hand. You can read more below in King Tides and Climate Change. | | |
Eating plant based foods will lower your footprint. If you eat meat in your diet on a daily basis, try substituting with meat with a protein alternative such as beans or tofu. Meat from small, non-ruminant animals, such as chicken, turkey, rabbit and duck, has a much lower GHG footprint than beef and lamb. And meat alternatives that mimic the taste and texture of meat products can be effective at reducing demand for animal meat.
Mayo Clinic Meatless Meals
Benefits of Beans and Legumes
|
- Follow proper guidelines for food waste and composting at home.
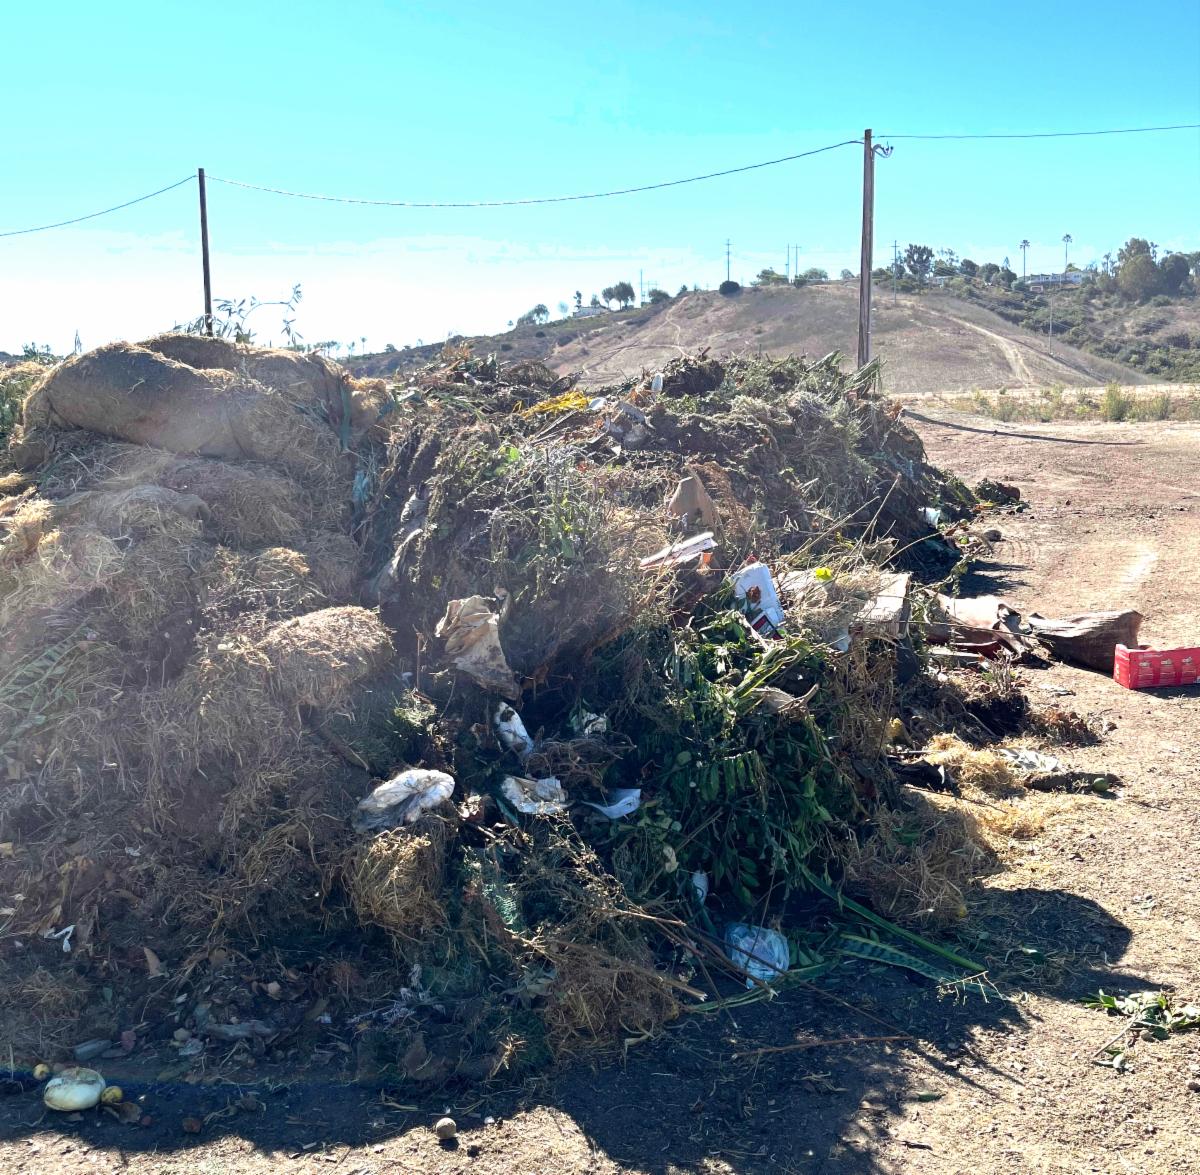
Check with your local waste management services for specific guidelines. Composting food waste properly will divert it from the landfill and creating methane. Make sure that only organic materials are placed in your green container. Trash place in the green container may contaminate the entire bin so it is no longer compostable.
The photo shows a pile of non-compostable trash that was separated out from compost bins at the El Corazon Compost Facility in Oceanside. (photo by E. Bartlett)
| |
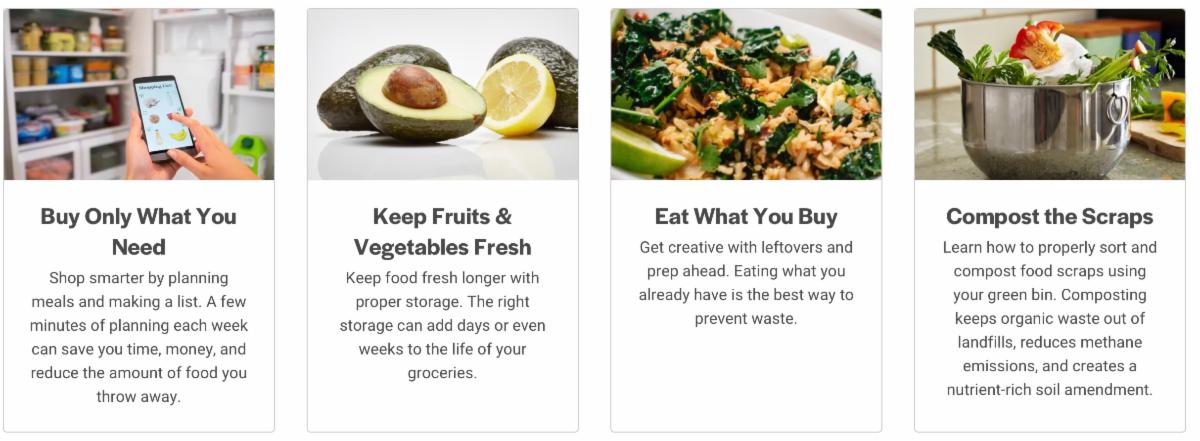
- Prevent Food Waste at Home.
Most people don't realize how much food they throw away every day — from uneaten leftovers to spoiled produce to parts of fruits and vegetables that could be eaten or repurposed. Preventing food from going to waste is one of the easiest and most powerful actions you can take to save money and reduce your environmental footprint. The average family of four spends almost $3000 a year on food that does not get eaten. (SOURCE)
Please read more:
| | Event Calendar for November | | |
Sat, Nov 14
Rancho La Costa Restoration
9:00 am - 10:30 am
To RSVP or for more info contact:
info@preservecalavera.org
or Anne-Catherine: acrochlevecq@gmail.com
| |  | |
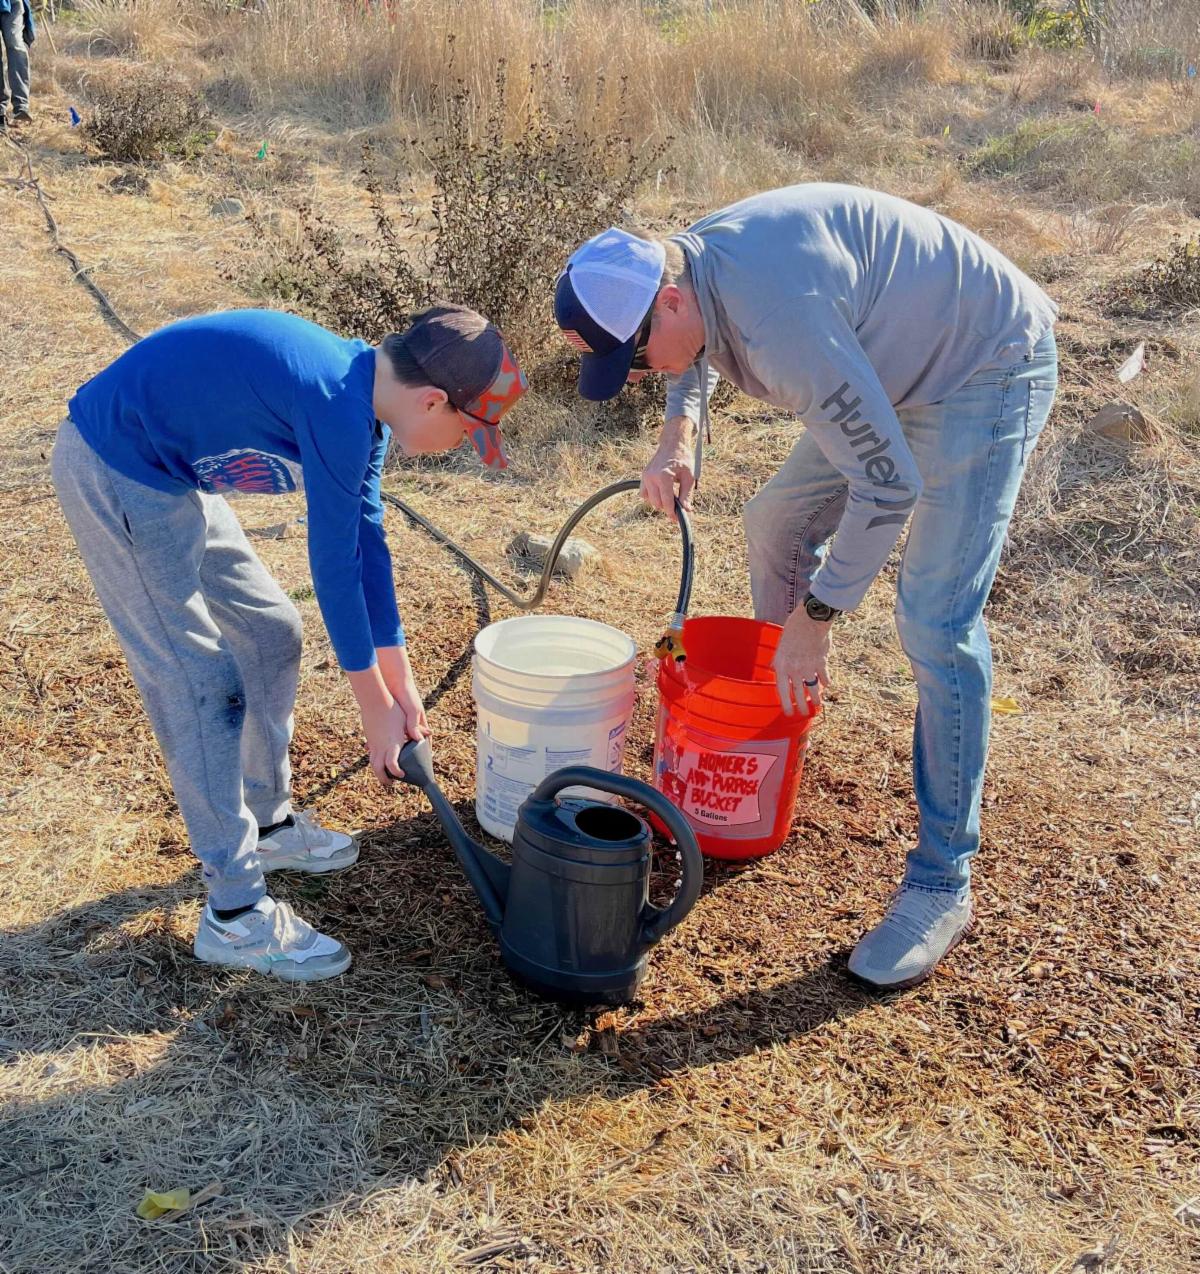
Removing non-native plants and watering native plants as needed.
Prepare: Wear appropriate (preferably long pants/sleeves) clothing, closed-toed shoes, and hat. Bring gloves, sunscreen and water.
| | |
Sat, Nov 21
El Corazon Restoration
9:00 am - 10:30 am
To RSVP or for more info contact:
info@preservecalavera.org
or call Diane:760-724-3887
| | | |
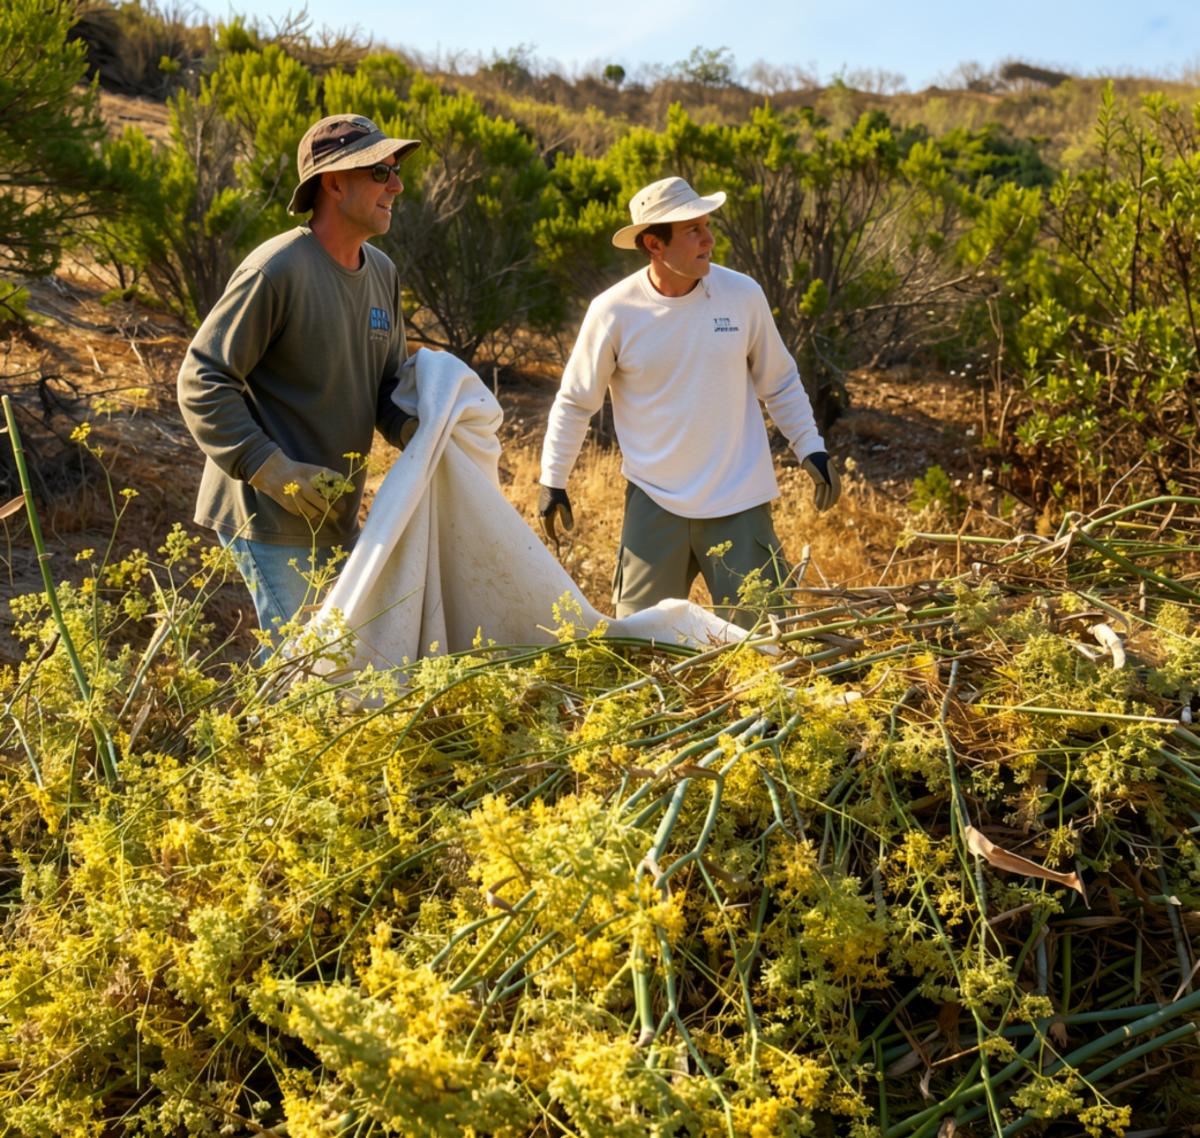
Removing invasive plants from this site.
Prepare: Wear appropriate (preferably long pants/sleeves) clothing, closed-toed shoes, and hat. Bring gloves, sunscreen and water.
| | |
Tues, Nov 24 - Thurs. Nov 26
King Tide Events
Along our local coasts, you can view the King Tides at these times:
Tues, Nov 24: High 7:48 am 6.8 ft
Wed, Nov 25: High 8:29 am 7.0 ft
Thurs, Nov 26: High 9:15 am 6.8 ft
For more info an additional king tide dates this winter, check out their website:
CA King Tides Project
| | | |
The CA King Tides Project wants you to take and share your photos of the king tides events.
You can learn more in the article below.
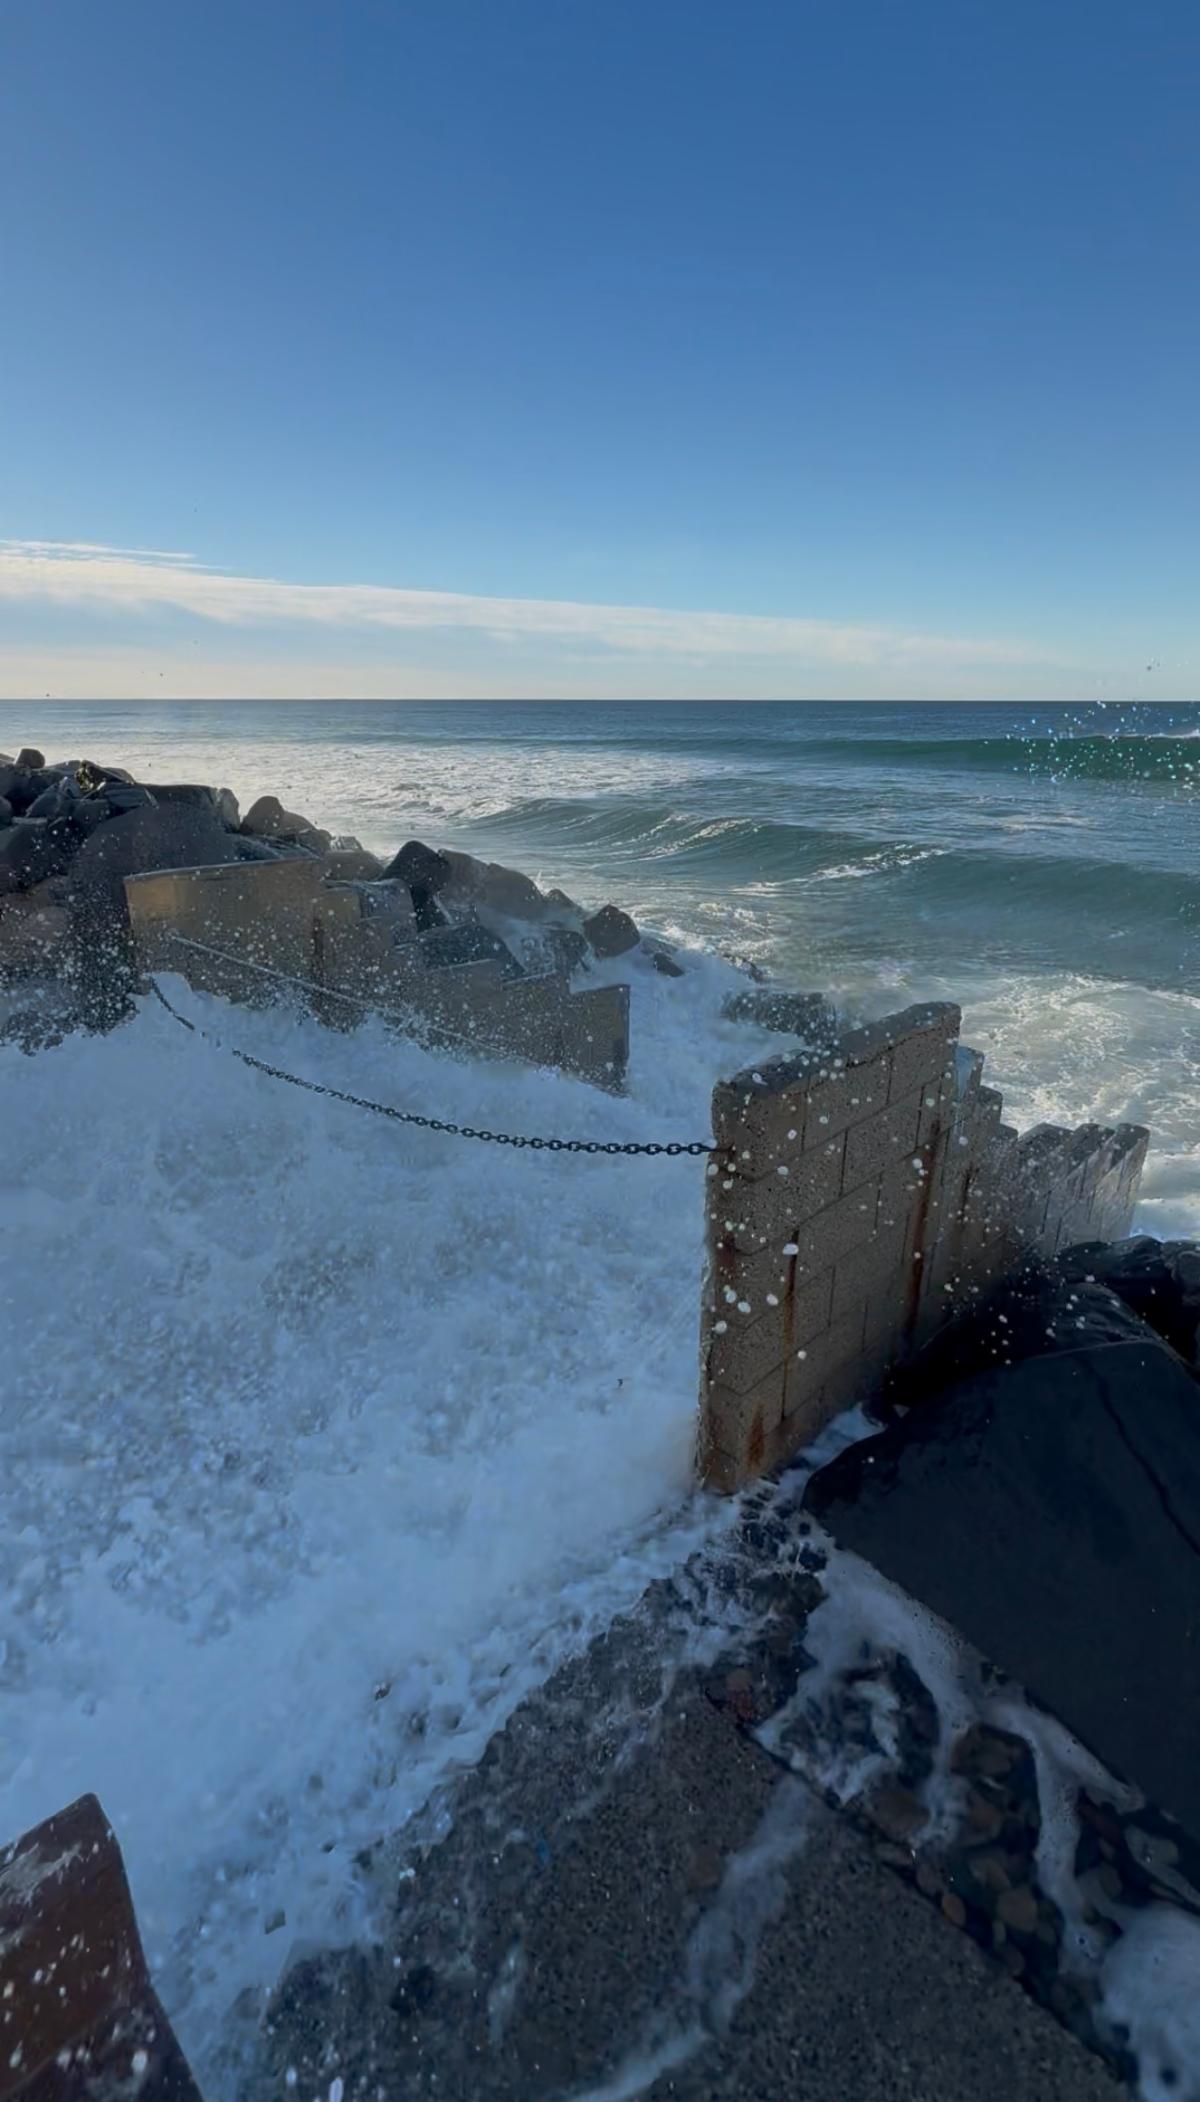
This photo was taken at the foot of Hayes St. in Oceanside on December 4, 2025 during a king tide event.
| |
Update on the Electrification Resolution Presented to OUSD
by Youth4Climate Intern, Carlos Lopez
| |
|
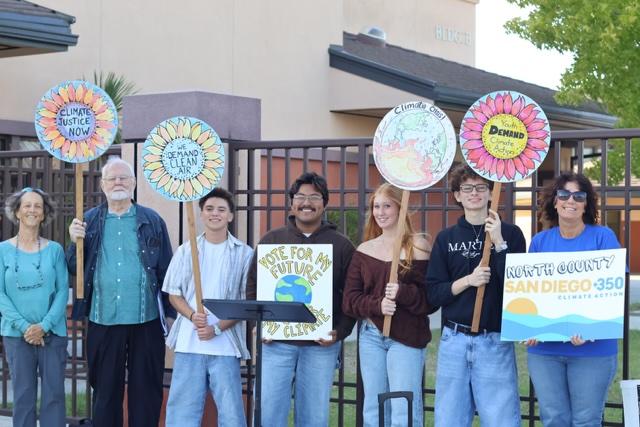
On October 13, students from El Camino High School's Youth Conservation Alliance and SanDiego350's Youth4Climate program brought their Electrification Resolution to the Oceanside Unified School District Board of Trustees. Since February, the student coalition has researched, drafted, and advocated for a resolution committing the district to phase fossil fuels out of its infrastructure by 2035, building on similar commitments already adopted by six other school districts in San Diego County.
Before the meeting, Youth4Climate held a press conference outside the district office. Inside, students filled the room, and three student speakers gave public comment for the first time. For nearly every student in attendance, it was their first school board meeting.
The Board approved Resolution No. 16, but without the five commitments students had proposed, citing cost concerns. The Board added an amendment directing the district to return with an update in March. While students were disappointed, the vote created a public record and a clear deadline to keep working toward.
Since the meeting, the coalition has accepted an offer from Dr. Mercedes Lovie, OUSD Associate Superintendent of Educational Support Services, to hold monthly meetings with students from November through February. The first meeting, on November 5, will focus on what the Board needs to see by March to adopt the students' commitments, and on clarifying which decisions belong to the district and where students can lead.
The students are deeply grateful to Preserve Calavera, Sierra Club, SanDiego350, and IBEW 569 for their guidance and support throughout this campaign. The work continues, and we hope community members will join us in March.
~Carlos Lopez
| | | | |
Students and allies at the press conference before the school board meeting. From left to right: Paige DeCino, Joe Houde, Rylee Pressley, Carlos Lopez, Elle McCarthy, Carlos Geronimo, Kathy Rallings
Preserve Calavera has partnered with SD 350 Climate Action to fund Carlos' intern position. Carlos is a student at El Camino High School. He works hard to inspire his peers to become climate justice warriors as well.
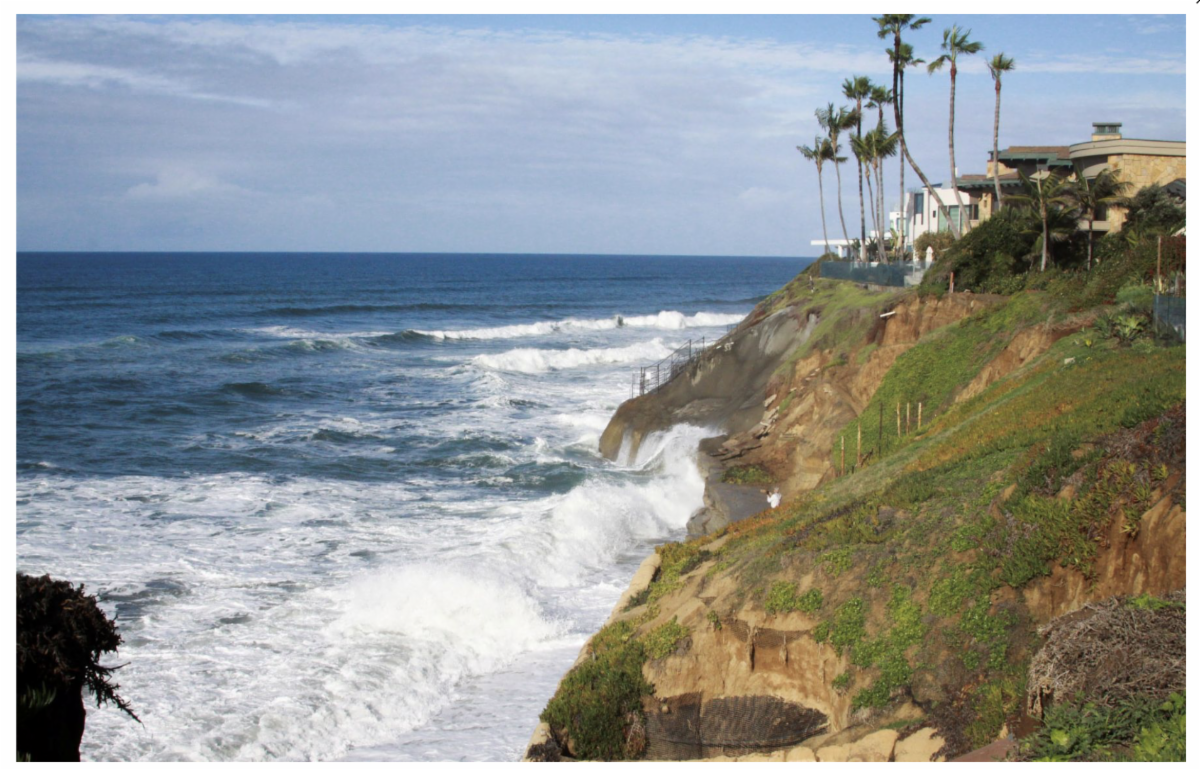
| | King Tides and Climate Change Meeting at a Beach Near You | | King tides provide the best opportunity to visualize today what our coastal future may hold. Coupled with storm events, king tides can cause extensive coastal damage. California, like many coastal areas worldwide, has lost 90% of its coastal wetlands which protect the coastline during high tides and storms. With rising sea levels, we’re expecting to see more encroachment to our beaches, roads and homes. | | | | At left, photo of Tamarack Beach during a king tide event in January, 2026. This image was posted as part of the CA King Tides Project. | | |
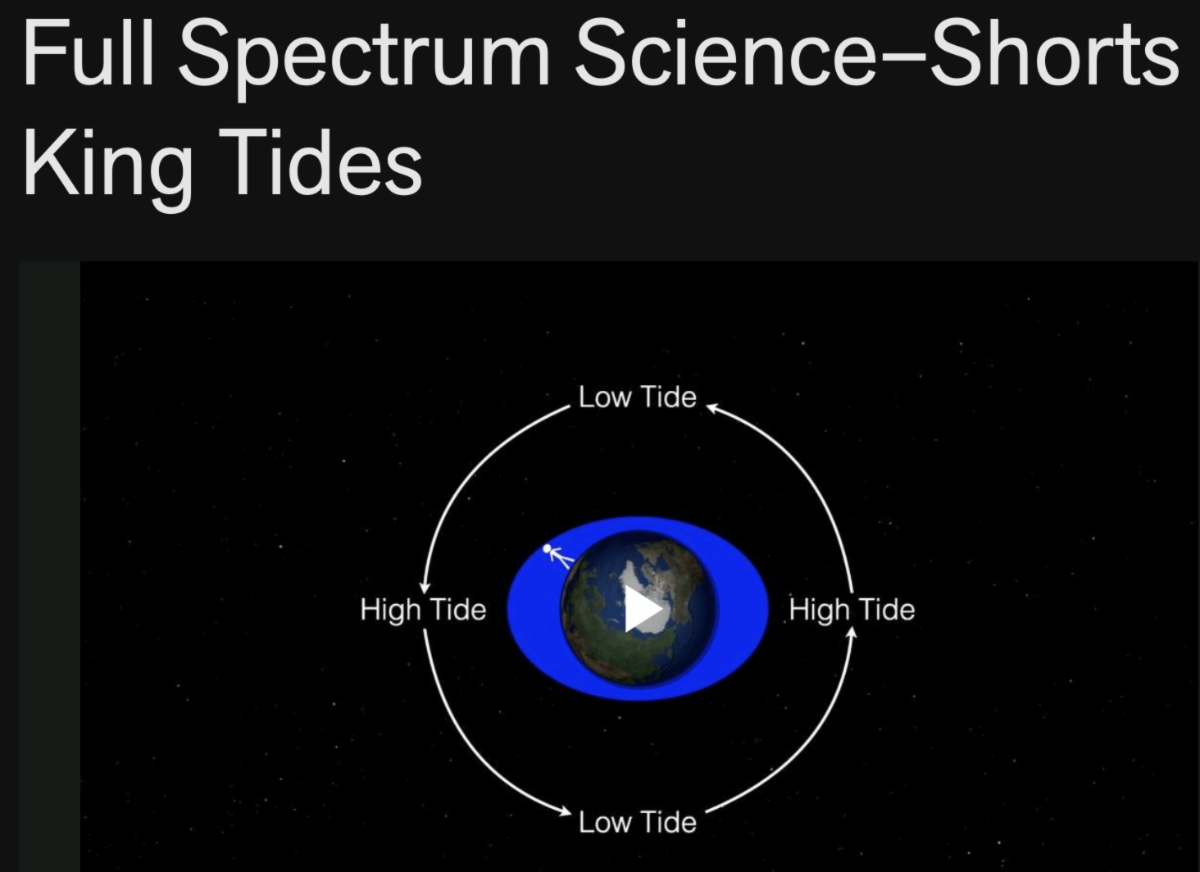
Tides are caused by the gravitational forces of the moon and the sun (the moon’s gravity has a larger effect on tides than the sun). When the Earth, moon, and sun are in alignment (during full and new moon) this causes an increased gravitational pull. There are several times a year during these alignments when the moon is at its closest point to Earth which causes the highest tides of the year; which is why they are known as king tides.
Combining king tides with sea level rise from climate change related to increased GHG emissions, is turning normal high tides into record-breaking coastal hazards.
| | Click on the video above from the Exploratorium Museum in San Francisco to learn more. | | |
California’s King Tides Project under the CA Coastal Commission aims to utilize crowdsourcing, aka community science, to collect photographs during the king tides as a visual catalog of these annual events. There will be three sets of king tides in our area this season:
November 24-26, 2026
December 23-25, 2026
January 21-22, 2027
The tidal times information for November is listed in our calendar above. You can check the Tides Map for additional times through the season. To participate you will need to either upload your photos on your web browser or use the free app Survey123. Please refer to detailed directions: Take and Share Photos.
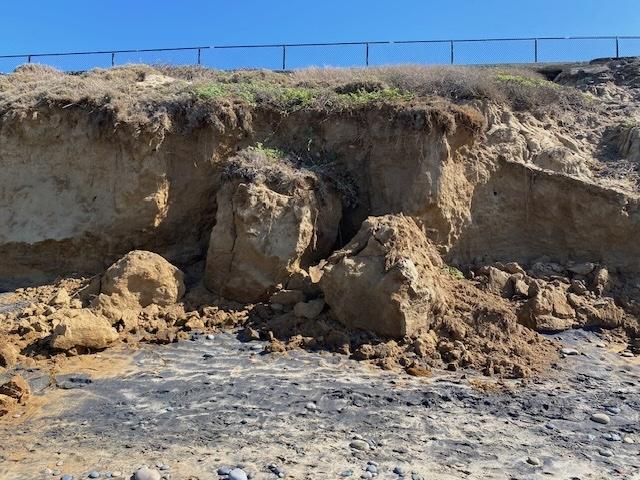
The photo below shows bluff failure near the parking lot at South Ponto Beach. This photo was taken on October 21. With king tides on the way this month, we will keep an eye on this spot. Photo by K. Merrill.
| | Wildlife Corner: The Goldspotted Oak Borer is a Big Pest for Our Oak Trees | | |
Where to begin when talking about the significance of oak trees in California?
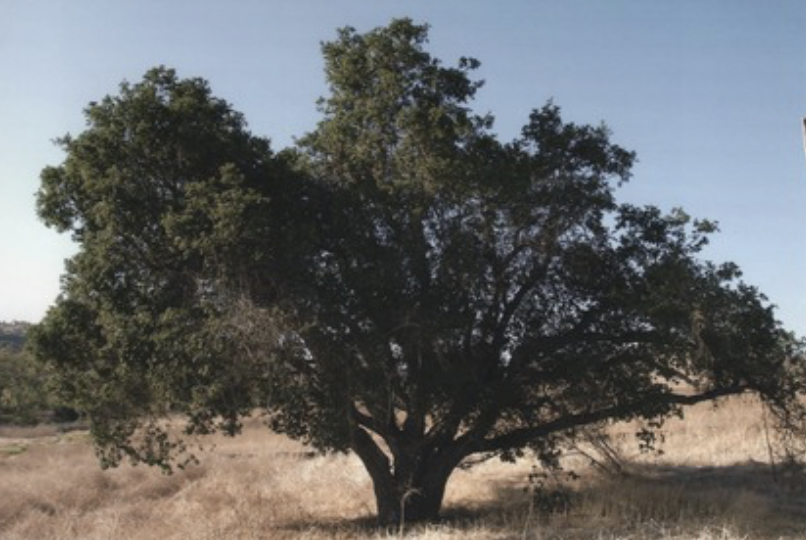
Entire ecosystems rely on them for survival. The coast live oak (Quercus agrifolia) is considered a keystone species. Hundreds of other species rely on this grand oak species for food and habitat, including mammals, birds, insects, reptiles, amphibians, fungi, and other plants.
Please read "Oak Trees: Preserving a Sense of Place" in our April 2024 newsletter,
| | |
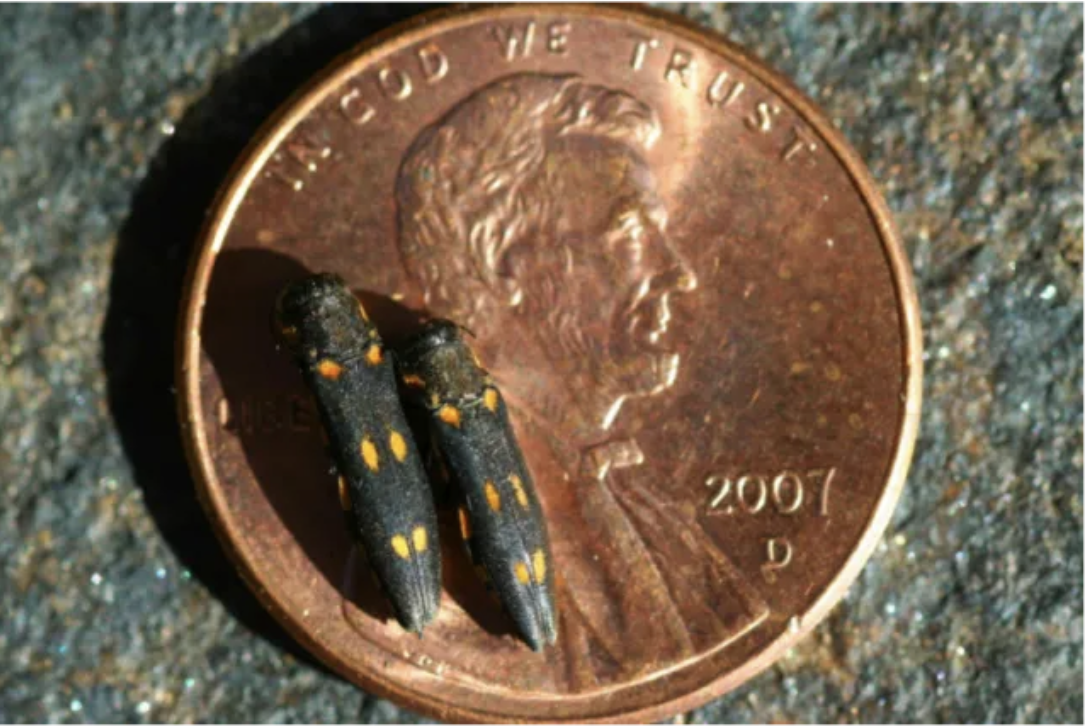
The goldspotted oak borer (GSOB) is an invasive pest that is native to Arizona. It's a tiny beetle causing a big problem for Southern California’s oak trees. Its larvae tunnel beneath the bark and feed on the tissues that transport water and nutrients, slowly starving the tree from the inside out. After several years of repeated infestations, the damage becomes too much, and the tree dies. GSOB has already killed tens of thousands of mature oaks across the region.
Goldspotted oak borer at right shown to scale with a penny. (Photo Source: Tom Coleman, U.S. Forest Service Entomologist)
| | Widespread oak mortality can have severe implications to the environment and human safety. Due to the current and potential impacts to California oaks and communities, public and private organizations are working together in the research, education and outreach efforts related to GSOB management. This includes the GSOB Blitz , a community-powered effort to detect and map GSOB infestations. The Blitz runs from October-December. | |
- It may seem hard to believe but there aren’t any teams in our area. You can follow this link if you are interested in forming a team. Teams survey oak trees across Southern California to identify where this pest is spreading, and how bad the damage is. These surveys help scientists and land managers decide where to take action to save our trees. It’s a great way to learn, explore, and connect with nature while making a real impact.
- And you can also make individual observation of local oak trees and upload a photo and report to their website: Report Goldspotted Oak Borer Symptoms
-
Get on their mailing list and keep track of how the efforts are going: Mailing List
Let's all do what we can to help monitor this pest!
| | |
How can you identify this pest in the field?
Check out this excellent video that describes how to identify GSOB.
And check out this guide from UC ANR: Field Identification Guide
| | | Find out more about the GSOB in this video. (It was produced in 2013 but has lots of great info) | | | Our all-volunteer organization can not do what we do without your help. Your time, talent and donation can make a difference right in your own backyard. | | | Contact us to see how else you could get involved. | To Make a Donation to Preserve Calavera | | And Check out our Website | And all of our past Newsletters can be accessed here. Lots of local information about our open space and wildlife issues. | | | | | |