|
Dear Friends,
Amongst the talk of Iran, Oman, and the Hormuz Strait there’s increasingly more chatter regarding inflation, interest rates, and the Federal Reserve’s next move. Current interest and scrutiny is coming on the new Fed Chair, Kevin Warsh. In his first FOMC appearance at the podium, Warsh was pinned as a “hawk rather than a dove.” Next week he’ll have an opportunity in Jackson Hole to confirm or deny those interpretations.
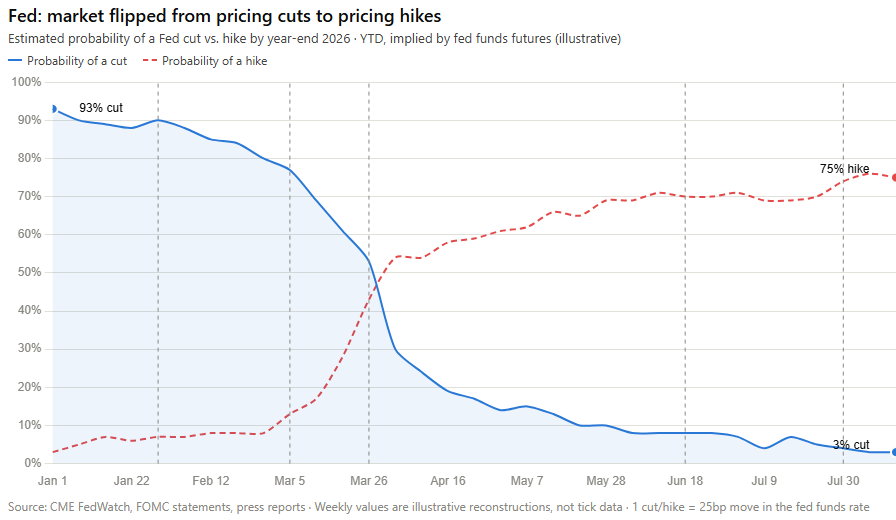
Many of the same so-called experts that are calling Warsh a hawk are the same forecasters that were expecting multiple fed fund rate cuts earlier this year, now only to completely flip their expectations to Federal Reserve hikes. See the graph Gray Howle on our Crescent team created to illustrate their incredible change of opinion.
They pulled a complete 180° turn! Just because an economist says something doesn’t make it true! The same goes for journalist and other TV, newsletter, and commercialized pundits.
I put together six timely and important questions on the topic, and Gray utilized several AI tools (Large Language Models, LLMs) that we’ve become accustomed to using daily to put together intelligent and succinct answers (with references) for each question.
I hope you find this of value. If you have other topics that you’d like us to explore and educate you on, please pass along those great ideas. Remember, we’re putting together these commentaries and thought pieces with you in mind!
1. How common is a 180° flip on Fed expectations intra-year?
Repricing happens constantly. A full directional flip does not. Markets adjust the expected pace of moves every year. January 2024 priced six cuts and got three. Late 2015 projected four hikes and delivered one. What makes 2026 different is that markets entered the year pricing rate cuts and are now pricing the possibility of multiple hikes by year-end. The expected direction of the next move reversed entirely, which puts it closer to 1994 or 2022 than to a normal year. The catalyst was a real shock rather than a change of mood. WTI crude ran from roughly $57 to a $113 peak while core PCE accelerated from 3.0% to 3.4%, and hike odds crossed 50% for the first time on March 27. Expectation swings are annual. True reversals show up maybe once a decade, and they usually require an inflation surprise.
References: iShares/ BlackRock, CNBC, CME FedWatch
2. How accurate have such forecasts been?
Not very. Apollo compared the Fed's dot plot, published since 2012, against fed funds futures and found both are "almost always wrong," that the two track each other closely, and that they miss in the same direction, which suggests the market largely takes its cue from the Fed. The errors also follow a pattern. When rates are low, markets persistently price an imminent hike. When rates are high, they persistently price a cut. Cleveland Fed research found that futures rates on average overpredict the future funds rate. The Fed concedes the problem itself. Its projection materials publish confidence bands built from 20 years of forecast errors, and those bands are wide. The takeaway is that market pricing shows what people believe today, not necessarily what will happen. That applies to this year's flip as much as to anything else.
References: Apollo Academy, Morningstar, Federal Reserve Bank of Cleveland, FMOC
3. Do rising or falling Treasuries between Fed meetings reliably predict the Fed's next move?
At the short end, yes, reasonably well. The 2-year Treasury is the cleanest single instrument expressing the market's view of the average fed funds rate over the next two years, making it the most-watched proxy for the policy path. The track record backs that up. BCA Research found that over the last three decades, when the 2-year yield has risen above the fed funds rate, the Fed has gone on to hike. That signal is flashing right now: the 2-year has moved above the upper bound of the Fed's target range, a pattern that has often preceded rate increases. The long end is a much weaker guide, since the Fed does not control long-term yields, which also carry term premium and fiscal noise. So, watch the 2-year for direction, but hold it loosely. As question 2 showed, the market's timing is frequently wrong even when its direction is right.
References: Convex, Motley Fool/BCA Research, Charles Schwab, Bondsavvy
4. What has Jackson Hole historically meant for rates?
Jackson Hole has repeatedly been the venue for policy pivots. Ben Bernanke used the 2010 speech to lay groundwork for QE2. Jay Powell's eight-minute 2022 speech ended hopes of a quick pivot and stocks dropped about 3.5% that day. Powell’s 2024 remark that "the time has come" teed up the September cut. So chairs do hint, fairly often. The market's read on the next meeting is usually right. Its read on the longer path is frequently wrong. After the 2022 speech, investors still underestimated how far rates would climb. This year carries more weight than usual. Warsh gives his first keynote as Chair on Friday, August 28th, having removed forward guidance from Fed communication, 19 days ahead of a September 16th decision where hike-or-hold odds sit near a coin flip. He has promised "big questions" rather than near-term signals.
References: Investing.com and BigGo Finance
5. What does a hike or cut do to the economy and the typical citizen?
The fed funds rate is the price of overnight money, and it spreads outward from there. Credit card APRs, auto loans, home equity lines and small business credit reprice fairly quickly. Savers see money market and CD yields move almost immediately. Mortgages are the notable exception, because they follow the 10-year Treasury rather than the Fed. That is why 30-year mortgage rates actually rose after the Fed began cutting in late 2024. For businesses, higher rates raise the bar on new investment and hiring, and lower rates lower it. The complication is timing, since policy changes take roughly 12 to 18 months to work through growth and inflation. For a typical household, one 25 basis point (0.25%) move barely registers. What matters is the cumulative direction across a full cycle, and whether inflation gets contained along the way.
References: CNBC and Yahoo Finance
6. How do rates today's compare to long-term averages?
Current rates only look high against recent memory. The fed funds target sits at 3.50% to 3.75%, above the roughly 1.5% average of the past 20 years, though that stretch was dominated by near-zero policy from 2008 to 2015 and again from 2020 to 2022. Measured against the full history back to the 1950s, where the average runs near 4.6%, today's setting is below normal. The 10-year Treasury tells a similar story. It yields about 4.69% today, close to a 19-month high of 4.75%, versus a 20-year average near 3.0% but a long-run average closer to 5.8% since the early 1960s. The 2010s were the outlier. Clients anchored to 3% mortgages and zero-yield savings accounts are comparing today against the cheapest money in modern history.
References: NY Fed via TradingEconomics/, fedprimerate.com, FRED
Chairman Warsh’s comments in Jackson Hole next week might not have been on your radar, but now I hope you’re more educated on the importance of his speech. Whatever he says will be poured over by talking heads and market experts alike. Just one week ago, the odds of a hold versus a hike at the September meeting were 50/50, whereas now they sit at a 65/35 split. I’m sure we’ll see more forecast changes upon the completion and analysis of his Jackson Hole speech!
Despite all this related to the Fed as well as Iran and the Strait, equity markets (while volatile) have remained resilient and still sit near all time highs. As mentioned in previous emails, the Mag 7 stocks have shown some renewed strength from their lows as have the semiconductor and data center support company stocks. It’s a wide and healthy market. Hopefully, the Fed doesn’t flip equities from bullish to bearish.
Sincerely,
Emory
|