|
|
The next 100 million crypto investors. |
|
Health, Wealth, and Happiness |
|
|
"If constructive thoughts are planted, positive outcomes will be the result. Plant the seeds of failure and failure will follow."
- Sidney Madwed
|
|
|
|
Crypto Market Outlook
by Vlad Vronsky
|
|
Dear Blockchain Believers,
Beware of more bears!
Remaining underwater has been painful, but how long will this bear market last? My take is that there’s still more room for a true bottom formation to occur.
Sure, there’s been a “relief” rally, but the data I'll show you today will spotlight some key metrics to show you the worst may not yet be over.
Investor Takeaways:
- Assess your current holdings. Can you hold on, or do you need to liquidate?
- Remain adaptive to a scenario where the bitcoin price goes to $15K.
- Chill out on the leverage!
- DCA where you feel confident.
Let’s dive in.
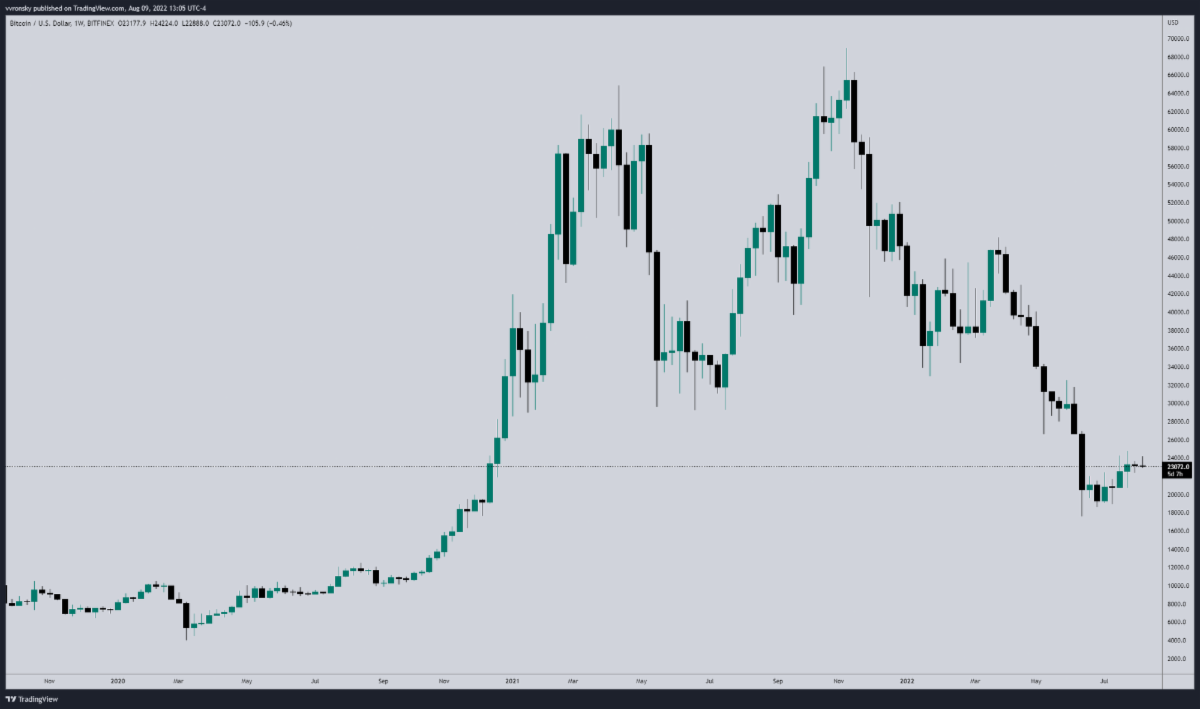
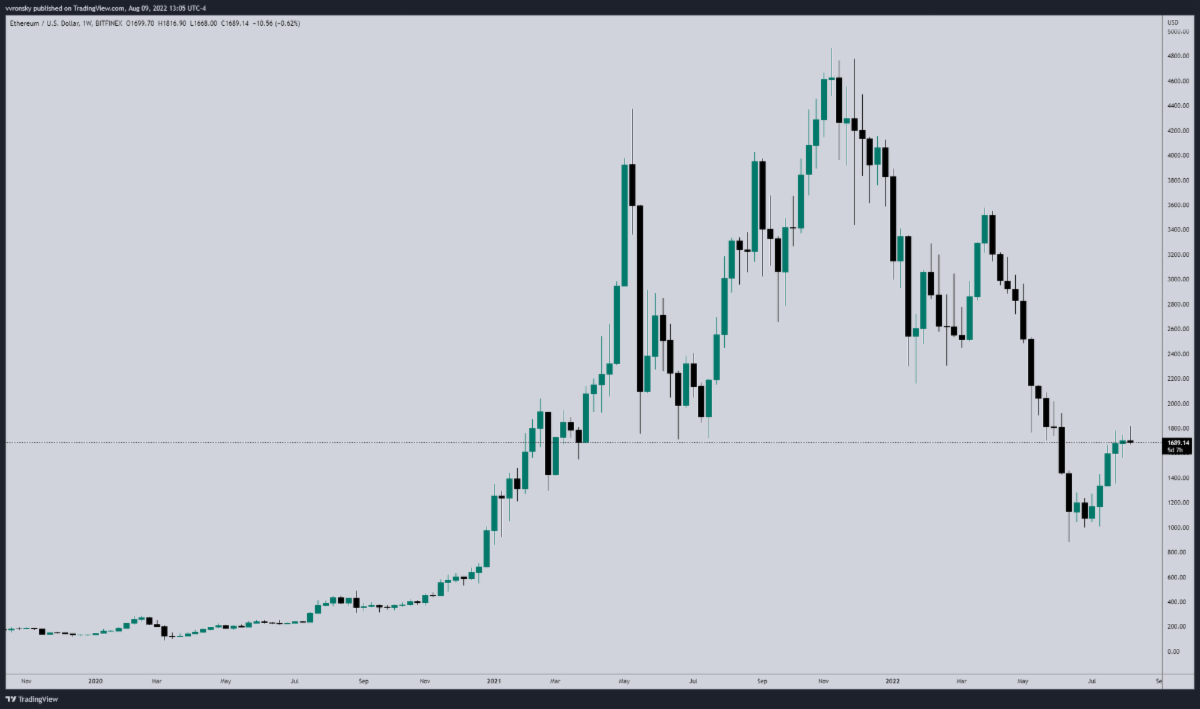
I want to review the weekly price action of the top two cryptocurrencies: bitcoin and Ethereum. Each bar that you see on the following chart represents one week (five days cumulatively).
|
|
ETH weekly
Crypto Market Pulse Check
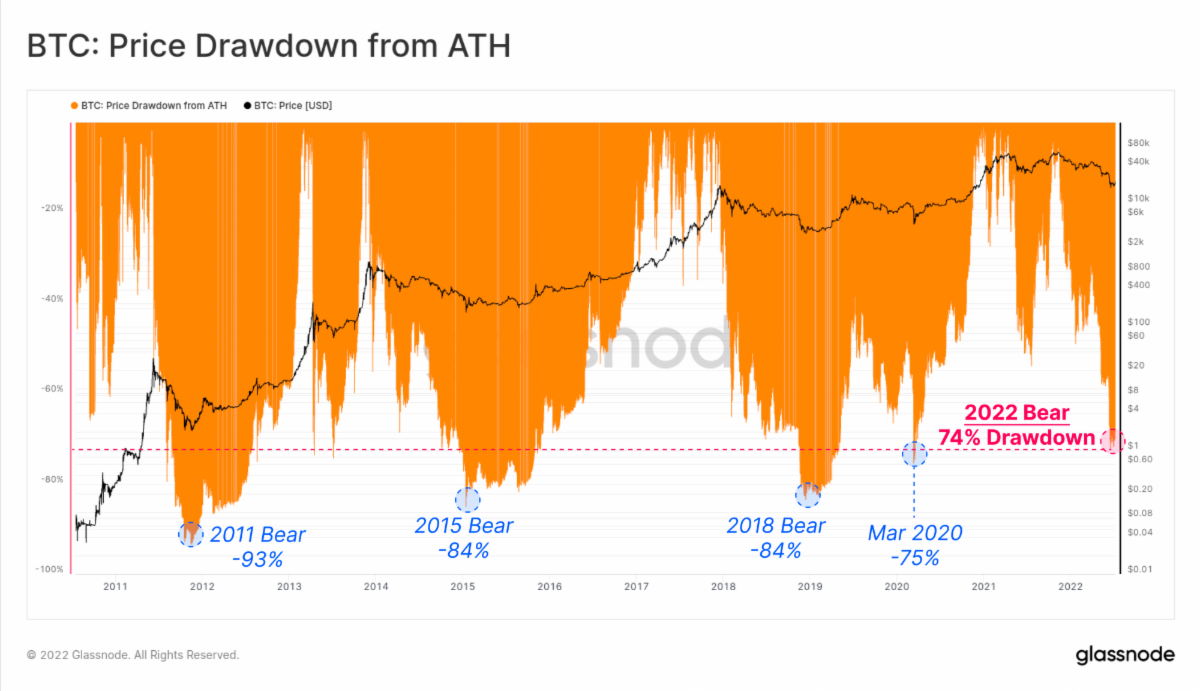
The BTC price has now fallen 74% from the $68.3K ATH, reaching a relatively low $17.6K on June 18.
So far, the 2022 bears remain the least severe in history from a drawdown perspective, though the scale and magnitude of their impact is arguably the largest to date.
Over time, bitcoin bear markets have bottomed at marginally less severe drawdowns each cycle. They range from -93% in 2011, to -84% in 2015 and 2018, and -75% in March 2020.
|
|
The pain is a little less each time. (Courtesy Glassnode)
Next, we dive into the Realized Price and its derivative the MVRV Ratio.
-
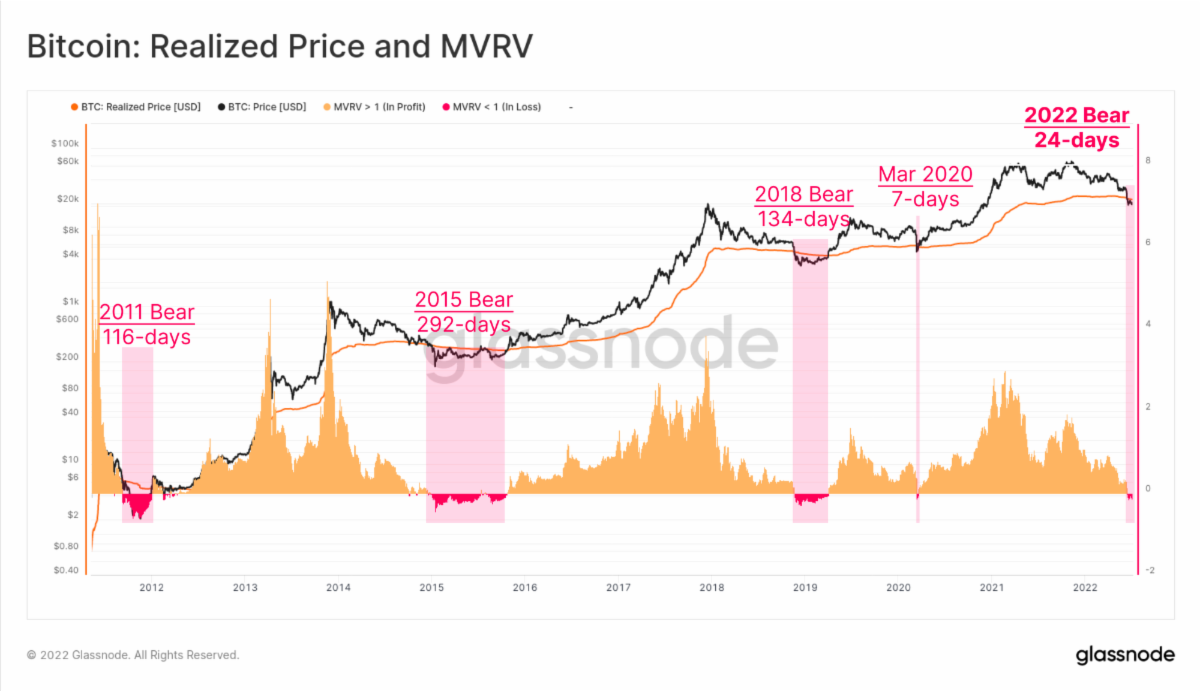
Realized Price is the average price of the bitcoin supply, valued at the day each coin last transacted on-chain. This is often considered the "on-chain cost basis" of the market.
-
MVRV Ratio is the ratio between the market value (MV, spot price) and the realized value (RV, realized price), allowing for a visualization of bitcoin market cycles and profitability.
All historical bitcoin bears have seen prices dip below the realized price for an average period of 180 days (excluding March 2020, which lasted just seven days).
When spot prices trade below the realized price, the MVRV ratio will trade below a value of 1. This signals that the average bitcoin investor is holding coins below their on-chain cost basis and is carrying an unrealized loss.
|
|
This means investors were carrying an unrealized loss for an average of 180 days. If that's the case in this cycle, we can expect more days to remain in unrealized losses.
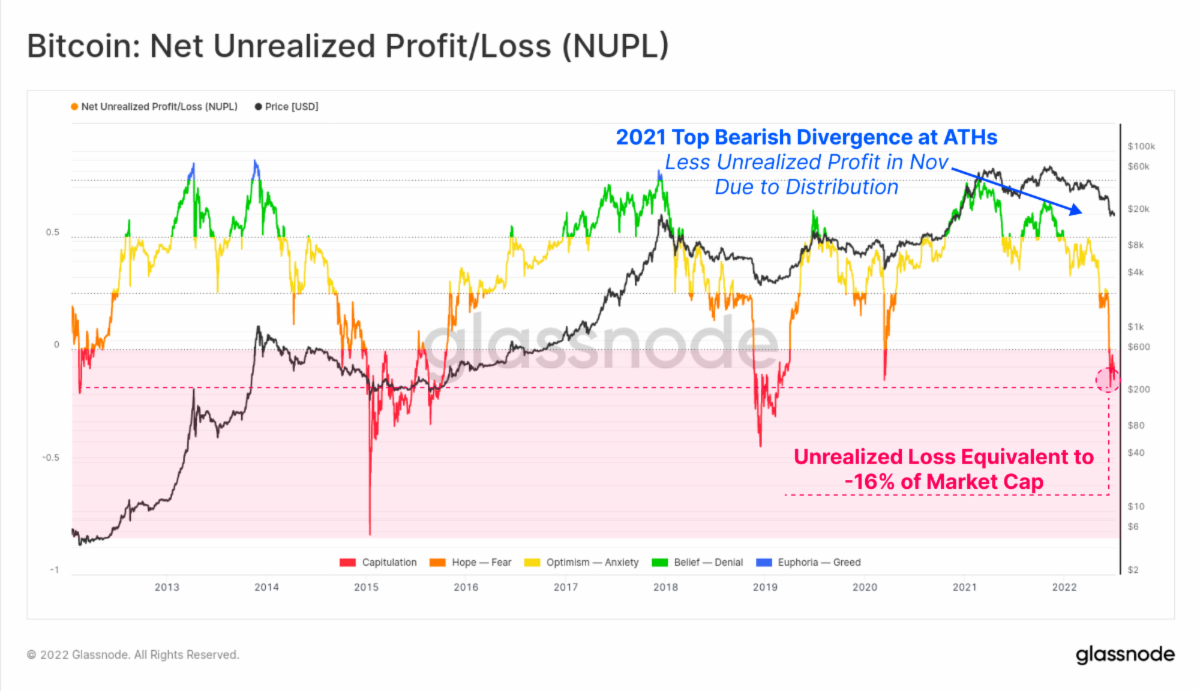
We can also quantify how large the net unrealized loss is via the NUPL metric (presented as a proportion of market cap). There are two key insights to be drawn from the 2021-22 cycle:
-
A macro bearish divergence is seen to have developed between the April and November market peaks (shown below in blue). This is a result of investors spending their coins during the Aug-Nov 2021 rally, making for a higher aggregate cost basis and a smaller unrealized profit held in the system (i.e., many investors took profits on the way up).
-
Unrealized losses held within the bitcoin network are currently equivalent to 16% of the total market cap. This is at a similar magnitude to historical bear markets. However, it's a bit less severe than the 2015 and 2018 lows.
|
|
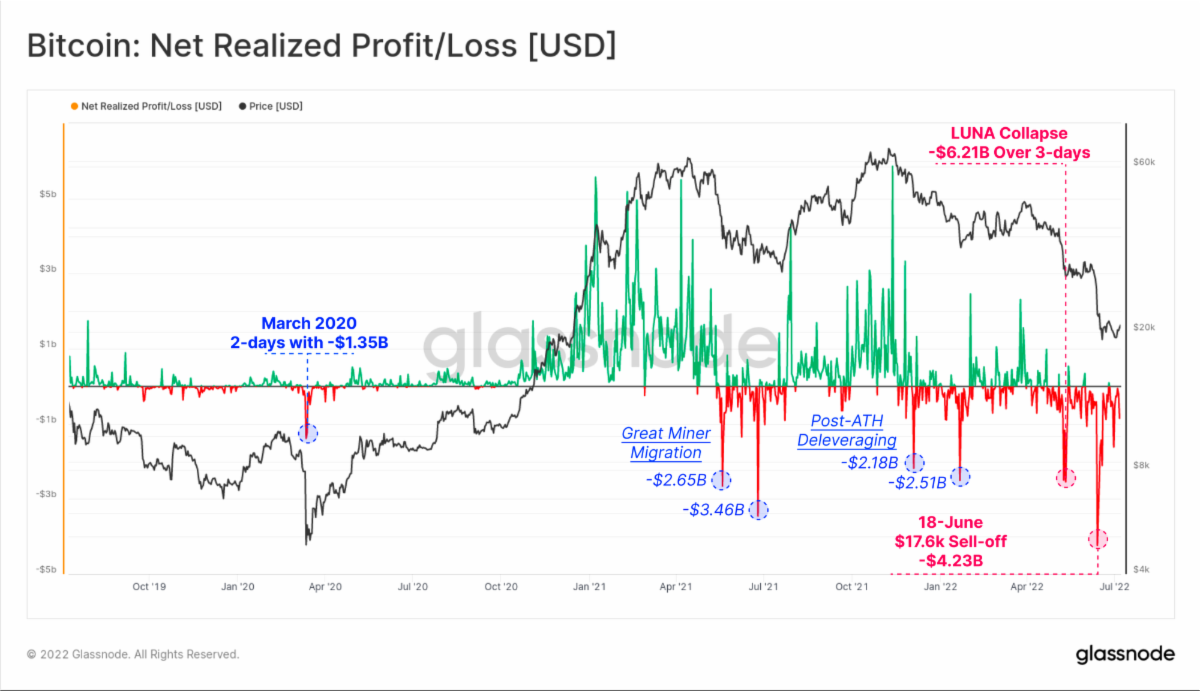
As the bitcoin market size grows, the magnitude of potential USD-denominated profit and loss can be expected to increase. Over the 2021-22 cycle, there have been six major "capitulation" events where investors realized historically large losses on-chain.
Note that a realized loss occurs when investors who acquired coins at higher prices spent them at lower prices, locking in the loss. Net realized profit/loss is then calculated by subtracting realized losses from realized profits each day.
- May-July 2021 saw prices sell-off to $29K during the Great Miner Migration. During this time, there were two days with net realized losses of $2.65B and $3.46B, both of which were the largest in history at the time.
- Dec 2021 and Jan 2022 saw the market trade down from the $68.3K ATH and experience two deleveraging events. These days realized net losses of $2.18B and $2.51B, respectively.
- May-June 2022 saw credit contagion take hold in the market. As the LUNA-UST project collapsed in mid-May, bitcoin investors realized net losses in excess of -$6.21B over a three-day period. The second event occurred on June 18 as bitcoin prices fell to $17.6K and set the current record for one-day net realized loss of $4.23B. This occurred as BTC prices broke below the previous ATH cycle for the first time in history.
|
|
Despite this being a marginally smaller drawdown when compared to previous bear markets, the 2021-22 bitcoin dip has been punctuated by numerous, very large capitulation events and steep declines in investor profitability.
We likely have a while to go before we can confidently say we're in bullish territory. When there's blood on the street, smart investors assess and buy where feasible.
As always, I welcome your feedback and insight.
|
|
Keep believing,
Vlad Vronsky
BMJ Market Analyst
|
|
|
|
ICYMI
In Case You Missed It
|
|
The top projects and their tokens.
How to reprogram your brain to achieve your financial goals (or anything else).
See the trends before the market does (premium members).
RIP, GPUs.
How to get the best rates on USDT lending and staking.
|
|
|
|
Share This Meme
Copy, paste, and post
|
|
To beat the market, you sometimes have to bet against the market.
|
|
Bitcoin Market Journal is a daily newsletter that makes you a better crypto investor. It is created by John Hargrave, Nick Marinoff, Steve Walters, Anatol Antonovici, Daniel Joel, Stephen Robert, and Vlad Vronsky.
Premium subscribers get full access to our top crypto picks. Both free and premium subscribers get content to build them into better investors.
|
|
|
|
|
|
|